TiDB 5.4 Performance Testing is Low, How to Optimize, Help Needed

Note:
This topic has been translated from a Chinese forum by GPT and might contain errors.

Original topic: tidb5.4测试性能低,如何调优,求救

| username: fangfuhaomin

[TiDB Usage Environment]
System: conts7
3 virtual machines, 32C+32G
TiUP installation 5.4.1
Testing with sysbench
Reference official test documentation: TiDB Sysbench 性能对比测试报告 - v5.4.0 对比 v5.3.0 | PingCAP 文档中心
Cluster deployment optimized according to official guidelines, reference: TiDB 环境与系统配置检查 | PingCAP 文档中心

[Overview] Scenario + Problem Overview
Test command:
sysbench /usr/local/share/sysbench/tests/include/oltp_legacy/oltp.lua
–threads=32
–time=120
–oltp-test-mode=complex
–report-interval=1
–db-driver=mysql
–mysql-db=test
–mysql-host=127.0.0.1
–mysql-port=4000
–mysql-user=root
–mysql-password=‘’
run --tables=10 --table-size=1000000
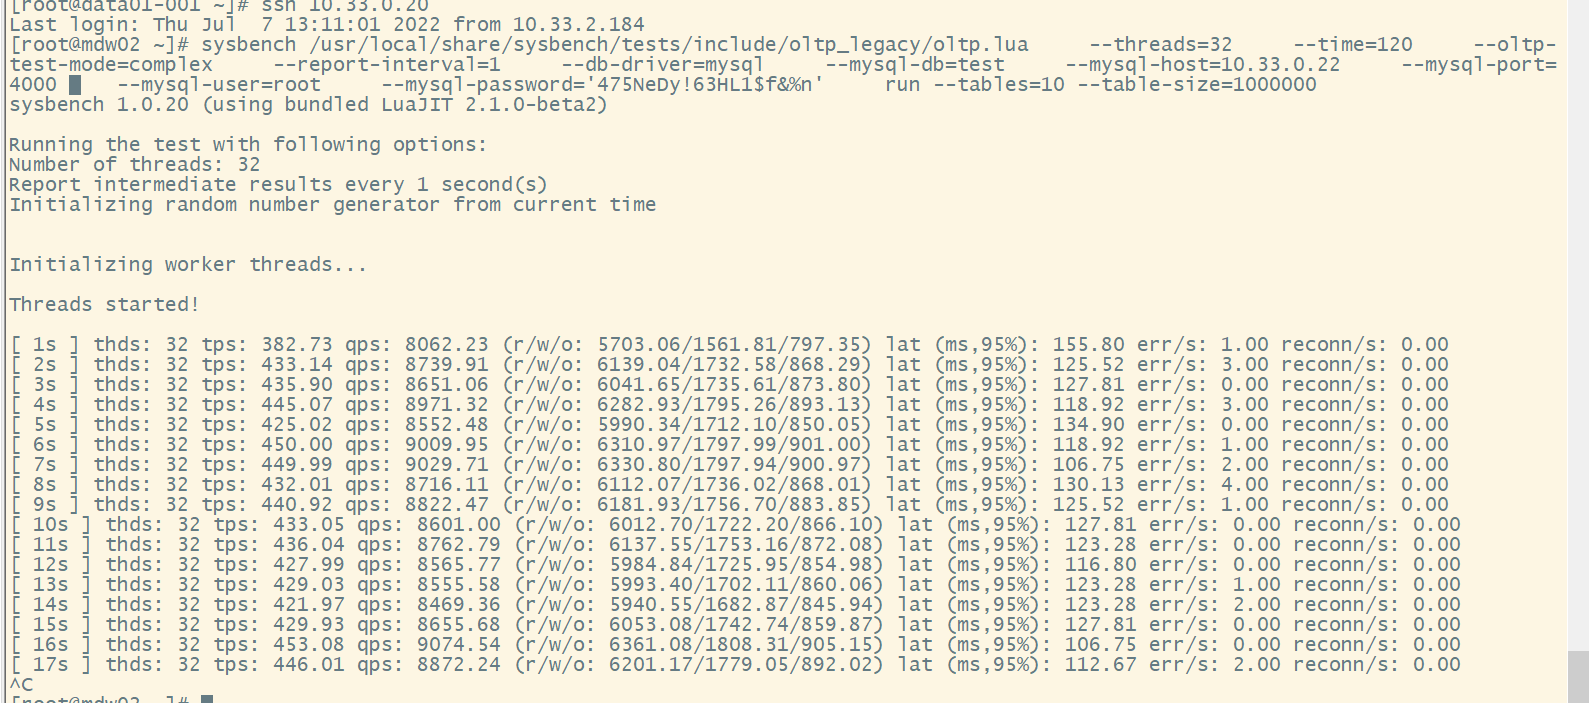
[Test Results]
Running the test with the following options:
Number of threads: 32
Report intermediate results every 1 second(s)
Initializing random number generator from current time

Initializing worker threads…

Threads started!

[ 1s ] thds: 32 tps: 416.98 qps: 8742.65 (r/w/o: 6179.07/1696.78/866.80) lat (ms,95%): 127.81 err/s: 1.99 reconn/s: 0.00
[ 2s ] thds: 32 tps: 466.10 qps: 9411.10 (r/w/o: 6590.47/1885.42/935.21) lat (ms,95%): 114.72 err/s: 4.00 reconn/s: 0.00
[ 3s ] thds: 32 tps: 456.06 qps: 9200.30 (r/w/o: 6464.91/1820.26/915.13) lat (ms,95%): 121.08 err/s: 1.00 reconn/s: 0.00
[ 4s ] thds: 32 tps: 453.04 qps: 8951.88 (r/w/o: 6248.62/1801.18/902.09) lat (ms,95%): 137.35 err/s: 0.00 reconn/s: 0.00
[ 5s ] thds: 32 tps: 471.86 qps: 9554.10 (r/w/o: 6705.97/1899.42/948.71) lat (ms,95%): 112.67 err/s: 1.00 reconn/s: 0.00
[ 6s ] thds: 32 tps: 475.09 qps: 9506.72 (r/w/o: 6650.20/1905.34/951.17) lat (ms,95%): 108.68 err/s: 1.00 reconn/s: 0.00
[ 7s ] thds: 32 tps: 472.97 qps: 9412.31 (r/w/o: 6585.52/1879.86/946.93) lat (ms,95%): 112.67 err/s: 1.00 reconn/s: 0.00
[ 8s ] thds: 32 tps: 464.41 qps: 9388.10 (r/w/o: 6588.65/1869.63/929.82) lat (ms,95%): 118.92 err/s: 1.00 reconn/s: 0.00
[ 9s ] thds: 32 tps: 446.45 qps: 8890.98 (r/w/o: 6213.27/1782.80/894.90) lat (ms,95%): 139.85 err/s: 2.00 reconn/s: 0.00
[ 10s ] thds: 32 tps: 467.03 qps: 9340.66 (r/w/o: 6539.46/1866.13/935.07) lat (ms,95%): 118.92 err/s: 1.00 reconn/s: 0.00
SQL statistics:
queries performed:
read: 64932
write: 18522
other: 9262
total: 92716
transactions: 4624 (458.37 per sec.)
queries: 92716 (9190.89 per sec.)
ignored errors: 14 (1.39 per sec.)
reconnects: 0 (0.00 per sec.)

General statistics:
total time: 10.0853s
total number of events: 4624

Latency (ms):
min: 33.13
avg: 69.44
max: 342.81
95th percentile: 121.08
sum: 321088.75

Threads fairness:
events (avg/stddev): 144.5000/3.81
execution time (avg/stddev): 10.0340/0.02

[Issues]

  1. Only the TiDB connected node has a CPU usage of around 30%, while the other TiDB nodes have single-digit CPU usage.
  2. IO usage on all three nodes is 70-80%.
  3. Low TPS in the test, and there are error occurrences.
| username: hey-hoho | Original post link

Is sysbench and the TiDB cluster running on the same node?

| username: fangfuhaomin | Original post link

Sysbench is tested on another node, and it has also been tested on the same node with little difference.

| username: tidb狂热爱好者 | Original post link

TiDB has performance requirements that differ from MySQL, particularly in terms of disk requirements. MySQL can use HDD mechanical disks, whereas TiDB must use SSDs. Please first test whether the SSD performance reaches 500MB/s read and write speeds.

| username: tidb狂热爱好者 | Original post link

  1. Test disk write capability - The default file system has write caching, and the file system decides when to sync to the disk, so the write speed is generally fast.

time dd if=/dev/zero of=output.file bs=8k count=128000

  1. Test disk read capability - The default file system has read caching, so the read speed is generally fast. If the cache does not have the data, it reads directly from the disk, but subsequent reads are faster.

time dd if=output.file of=/dev/null bs=8k count=128000

| username: fangfuhaomin | Original post link

The disk used is a storage SSD, and the read/write performance is still good.

[root@mdw03 ~]# time dd if=/dev/zero of=output.file bs=8k count=128000
128000+0 records in
128000+0 records out
1048576000 bytes (1.0 GB) copied, 0.998806 s, 1.0 GB/s

real    0m1.001s
user    0m0.037s
sys     0m0.963s
| username: fangfuhaomin | Original post link

I checked Grafana, and there are these values in tikv-err. I am not sure if they are affecting performance.

| username: ngvf | Original post link

First, modify the topology file parameters as follows:

server_configs:
  pd:
    replication.enable-placement-rules: true
  tikv:
    server.grpc-concurrency: 8
    server.enable-request-batch: false
    storage.scheduler-worker-pool-size: 8
    raftstore.store-pool-size: 5
    raftstore.apply-pool-size: 5
    rocksdb.max-background-jobs: 12
    raftdb.max-background-jobs: 12
    rocksdb.defaultcf.compression-per-level: ["no","no","zstd","zstd","zstd","zstd","zstd"]
    raftdb.defaultcf.compression-per-level: ["no","no","zstd","zstd","zstd","zstd","zstd"]
    rocksdb.defaultcf.block-cache-size: 12GB
    raftdb.defaultcf.block-cache-size: 2GB
    rocksdb.writecf.block-cache-size: 6GB
    readpool.unified.min-thread-count: 8
    readpool.unified.max-thread-count: 16
    readpool.storage.normal-concurrency: 12
    raftdb.allow-concurrent-memtable-write: true
    pessimistic-txn.pipelined: true
  tidb:
    prepared-plan-cache.enabled: true
    tikv-client.max-batch-wait-time: 2000000

Then optimize the insertion speed of sysbench, or you can write a program to insert data yourself. Here is one I provide for you:
tidb_data_prepare-0.1 (5.3 MB)

| username: fangfuhaomin | Original post link

This YAML file cannot be modified online. How should I make changes?

| username: fangfuhaomin | Original post link

After adjustment and reload, the result did not change much.
[Test Results]


[Updated Configuration]
[root@mdw04 tidb]# tiup cluster show-config tidb-test
tiup is checking updates for component cluster …
Starting component cluster: /root/.tiup/components/cluster/v1.10.1/tiup-cluster show-config tidb-test
global:
user: tidb
ssh_port: 22
ssh_type: builtin
deploy_dir: /tidb-deploy
data_dir: /tidb-data
os: linux
monitored:
node_exporter_port: 9100
blackbox_exporter_port: 9115
deploy_dir: /tidb-deploy/monitor-9100
data_dir: /tidb-data/monitor-9100
log_dir: /tidb-deploy/monitor-9100/log
server_configs:
tidb:
prepared-plan-cache.enabled: true
tikv-client.max-batch-wait-time: 2000000
tikv:
pessimistic-txn.pipelined: true
raftdb.allow-concurrent-memtable-write: true
raftdb.defaultcf.block-cache-size: 2GB
raftdb.defaultcf.compression-per-level:
- “no”
- “no”
- zstd
- zstd
- zstd
- zstd
- zstd
raftdb.max-background-jobs: 12
raftstore.apply-pool-size: 5
raftstore.store-pool-size: 5
readpool.storage.normal-concurrency: 12
readpool.unified.max-thread-count: 16
readpool.unified.min-thread-count: 8
rocksdb.defaultcf.block-cache-size: 12GB
rocksdb.defaultcf.compression-per-level:
- “no”
- “no”
- zstd
- zstd
- zstd
- zstd
- zstd
rocksdb.max-background-jobs: 12
rocksdb.writecf.block-cache-size: 6GB
server.enable-request-batch: false
server.grpc-concurrency: 8
storage.scheduler-worker-pool-size: 8
pd:
replication.enable-placement-rules: true
tiflash: {}
tiflash-learner: {}
pump: {}
drainer: {}
cdc: {}
grafana: {}
tidb_servers:

  • host: 10.33.0.21
    ssh_port: 22
    port: 4000
    status_port: 10080
    deploy_dir: /tidb-deploy/tidb-4000
    log_dir: /tidb-deploy/tidb-4000/log
    arch: amd64
    os: linux
  • host: 10.33.0.22
    ssh_port: 22
    port: 4000
    status_port: 10080
    deploy_dir: /tidb-deploy/tidb-4000
    log_dir: /tidb-deploy/tidb-4000/log
    arch: amd64
    os: linux
  • host: 10.33.0.23
    ssh_port: 22
    port: 4000
    status_port: 10080
    deploy_dir: /tidb-deploy/tidb-4000
    log_dir: /tidb-deploy/tidb-4000/log
    arch: amd64
    os: linux
    tikv_servers:
  • host: 10.33.0.21
    ssh_port: 22
    port: 20160
    status_port: 20180
    deploy_dir: /tidb-deploy/tikv-20160
    data_dir: /tidb-data/tikv-20160
    log_dir: /tidb-deploy/tikv-20160/log
    arch: amd64
    os: linux
  • host: 10.33.0.22
    ssh_port: 22
    port: 20160
    status_port: 20180
    deploy_dir: /tidb-deploy/tikv-20160
    data_dir: /tidb-data/tikv-20160
    log_dir: /tidb-deploy/tikv-20160/log
    arch: amd64
    os: linux
  • host: 10.33.0.23
    ssh_port: 22
    port: 20160
    status_port: 20180
    deploy_dir: /tidb-deploy/tikv-20160
    data_dir: /tidb-data/tikv-20160
    log_dir: /tidb-deploy/tikv-20160/log
    arch: amd64
    os: linux
    tiflash_servers:
    pd_servers:
  • host: 10.33.0.21
    ssh_port: 22
    name: pd-10.33.0.21-2379
    client_port: 2379
    peer_port: 2380
    deploy_dir: /tidb-deploy/pd-2379
    data_dir: /tidb-data/pd-2379
    log_dir: /tidb-deploy/pd-2379/log
    arch: amd64
    os: linux
  • host: 10.33.0.22
    ssh_port: 22
    name: pd-10.33.0.22-2379
    client_port: 2379
    peer_port: 2380
    deploy_dir: /tidb-deploy/pd-2379
    data_dir: /tidb-data/pd-2379
    log_dir: /tidb-deploy/pd-2379/log
    arch: amd64
    os: linux
  • host: 10.33.0.23
    ssh_port: 22
    name: pd-10.33.0.23-2379
    client_port: 2379
    peer_port: 2380
    deploy_dir: /tidb-deploy/pd-2379
    data_dir: /tidb-data/pd-2379
    log_dir: /tidb-deploy/pd-2379/log
    arch: amd64
    os: linux
    monitoring_servers:
  • host: 10.33.0.21
    ssh_port: 22
    port: 9090
    ng_port: 12020
    deploy_dir: /tidb-deploy/prometheus-9090
    data_dir: /tidb-data/prometheus-9090
    log_dir: /tidb-deploy/prometheus-9090/log
    external_alertmanagers:
    arch: amd64
    os: linux
    grafana_servers:
  • host: 10.33.0.21
    ssh_port: 22
    port: 3000
    deploy_dir: /tidb-deploy/grafana-3000
    arch: amd64
    os: linux
    username: admin
    password: admin
    anonymous_enable: false
    root_url: “”
    domain: “”
| username: ngvf | Original post link

Okay, first refer to TiDB 性能分析&性能调优&优化实践大全 - TiDB 的问答社区 to see if you can optimize it to the desired effect. Actually, performance tuning is not something that can be explained in a few words. It requires a good understanding of TiDB architecture, principles, and monitoring metrics. I suggest looking at the following courses:
https://learn.pingcap.com/learner/course/120005
https://learn.pingcap.com/learner/course/540005
https://learn.pingcap.com/learner/course/570012
In summary, analyze each role (TiDB, PD, TiKV) to see where the slowdown is, modify the corresponding parameters, and check if the database tables are designed reasonably, etc.

| username: fangfuhaomin | Original post link

I analyzed the occurrence of the error and found it was because the official script /usr/local/share/sysbench/tests/include/oltp_legacy/oltp.lua was used, which specifies the database as sbtest. After modification, the performance improved, and the latency dropped to around 50, but it still doesn’t meet the requirements. Currently, the goal is to reduce it below 20. The current analysis suggests that the latency is preventing the TPS from increasing. Is there any method to address this?

| username: system | Original post link

This topic was automatically closed 1 minute after the last reply. No new replies are allowed.