Note:
This topic has been translated from a Chinese forum by GPT and might contain errors.
Original topic: tidb6.1.2 stats_meta 统计数据更新太频繁 ,有时候对应的table_id 没有数据也在频繁更新
[TiDB Usage Environment] Production Environment / Test / Poc
Production
[TiDB Version]
6.1.2
[Reproduction Path] What operations were performed to cause the issue
alter table Material_Participant_Daily_Report truncate partition(p20221124);
insert into Material_Participant_Daily_Report select xxx;
[Encountered Issue: Problem Phenomenon and Impact]
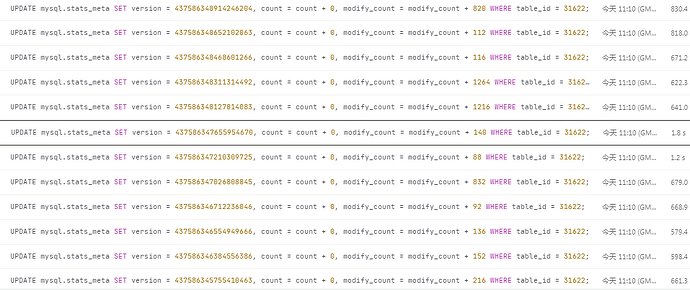
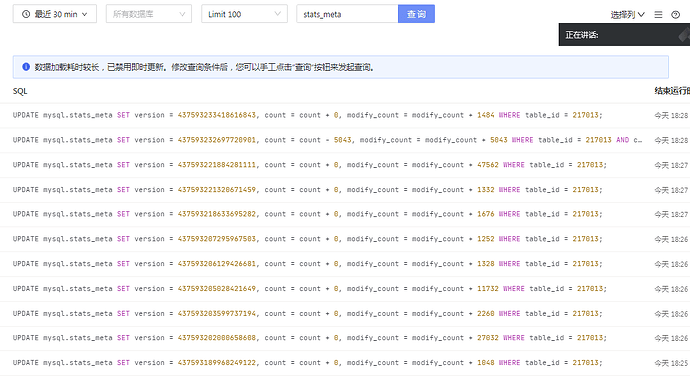
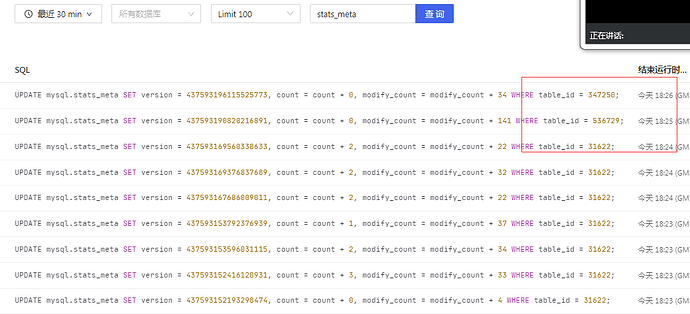
A large number of concurrent slow query logs: update mysql.stats_meta set version = 437586348311314492, count = count + 0, modify_count = modify_count + 1264 where table_id = 31622;
(user:tidbdba time: 11:15)[db: yixintui_operate]select * from mysql.stats_meta where table_id=31622;
Empty set (0.03 sec)
select * from information_schema.tables where tidb_table_id=31622;
yixintui_operate | Material_Participant_Daily_Report
No statistical data for the past two days. Because the data for the past two days is frequently truncated by partition.
[Resource Configuration]
[Attachments: Screenshots/Logs/Monitoring]
You can set it to not update.
How to set a single table to not update statistics?
(user: tidbdba time: 14:43) [db: yixintui_operate] DROP STATS Material_Participant_Daily_Report_old;
This command is particularly slow, possibly because there are too many partitions. It’s been almost 20 minutes and it still hasn’t finished.
Query OK, 0 rows affected (38 min 2.65 sec) # It took 38 minutes to execute successfully.
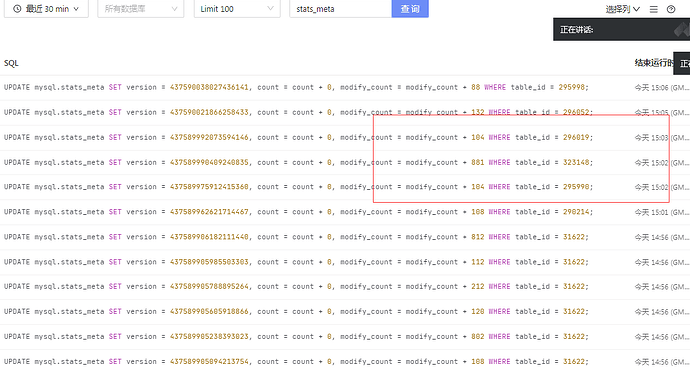
There is nothing, yet it frequently updates mysql.stats_meta with version = 437589775267397654, count = count + 0, and modify_count = modify_count + 28 where table_id = 31622. The table name has already been changed and appended with _old, so there shouldn’t be any update logic, but it still frequently updates the stats_meta information for 31622.
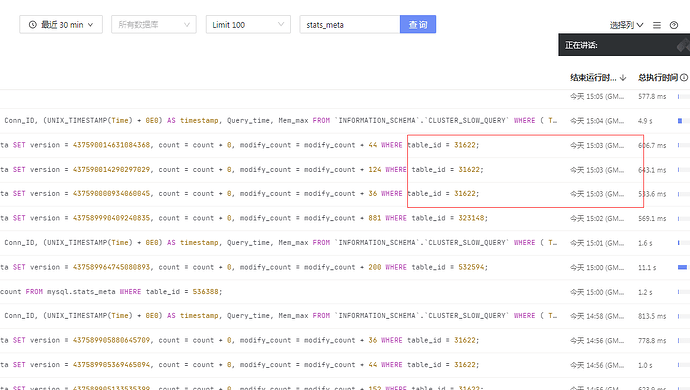
This statistical result is so surreal. Sometimes there is table_id=31622 at 15:03, and sometimes there isn’t. I thought I was hallucinating.
After dropping Material_Participant_Daily_Report_old, it was gone.
(user: tidbdba time: 16:48) [db: yixintui_operate] recover table Material_Participant_Daily_Report_old;
Query OK, 0 rows affected (2.25 sec)
Observe after recovery. If it doesn’t work, I’ll drop it again tomorrow. The data has been backed up, and it can be restored to the new backup table when needed.
—
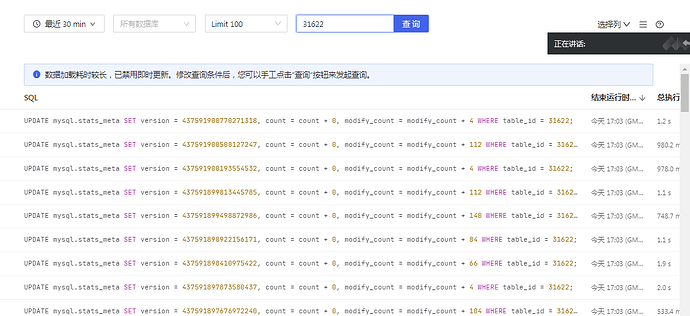
After recovery, 31622 came back again -----
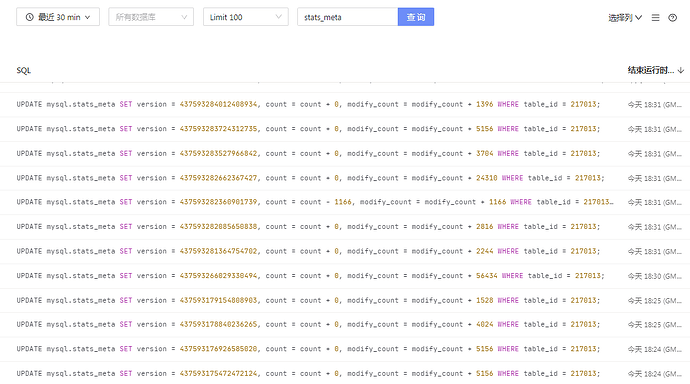
31622 dropped again. Now table_id= 217013 (hourly report Material_Participant_Hour_Report frequently updates statistics)
This dashboard statistic result is really damn magical. Just now I saw a large number of 217013 at 18:27, and after refreshing, it’s gone.
After refreshing again, a large number of 217013 appeared at 18:31 and 18:32.
I also found a lot of SQL statements updating mysql.stats_meta in my test environment.
Judging from your previous description, it should be a partitioned table. Is there no DML operation on any partition? The update of modify_count in stats_meta is quite frequent. You can check the latest update time of these tables through show stats_meta. The collection of statistics relies on modify_count to calculate the staleness of the statistics, and then collects statistics based on the relevant parameter settings.
