Note:
This topic has been translated from a Chinese forum by GPT and might contain errors.
Original topic: /tidb_data/prometheus-9090/docdb 占用大量空间,如何清理
[TiDB Usage Environment] Production Environment
[TiDB Version] v6.1.0
[Encountered Problem: Problem Phenomenon and Impact]
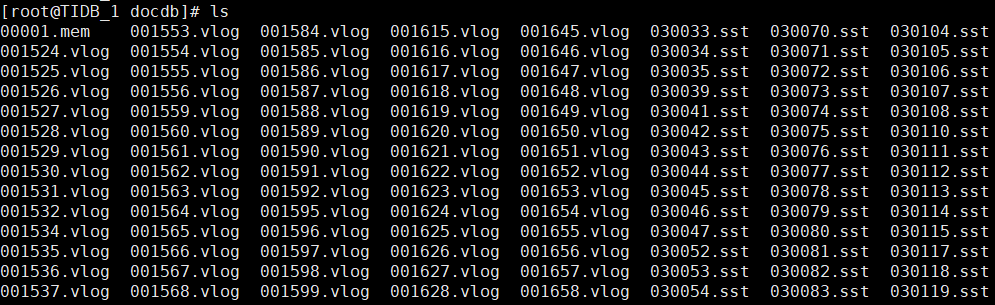
There are a large number of vlog data in the /tidb_data/prometheus-9090/docdb directory, occupying a lot of disk space. After checking related issues in the community, many people suggested scaling down and then scaling up, but do I have to scale down and up every few days? That’s too much. Others suggested configuring the parameter --storage.tsdb.retention=3d. I set it to 3 days and restarted Prometheus, but files older than three days still exist in the docdb. By checking the related process, it was found that the vlog files were generated by the ng-monitoring-server process, using the configuration file /tidb_deploy/prometheus-9090/conf/ngmonitoring.toml. In this configuration file, is it possible to configure the storage duration of related files, or is there any other way to limit the retention of these files?
Here are the monitoring logs, try compressing and backing them up.
I don’t want to back up, just delete. I can’t just set up a cron job with rm, there should be a parameter for this, but I don’t know which one.
I see that my directory only has data from the last 4 days. Check the timestamps on your files.
The vlog files are from the 11th to today, a total of 5 days.
If the docdb files are not needed, you can directly remove them with rm.
Changing storage.tsdb.retention in the conf file might not take effect; you need to modify it in the template file at .tiup/storage/cluster/clusters/${clustername}/config-cache/run_prometheus_{ip}_{port}.sh and then restart Prometheus.
I encountered the same issue and just deleted it directly.
Modify the expiration policy.
I deleted some files, and the /tidb-deploy directory became smaller, but when I checked the disk where /tidb-deploy is located using df, it didn’t show any reduction.
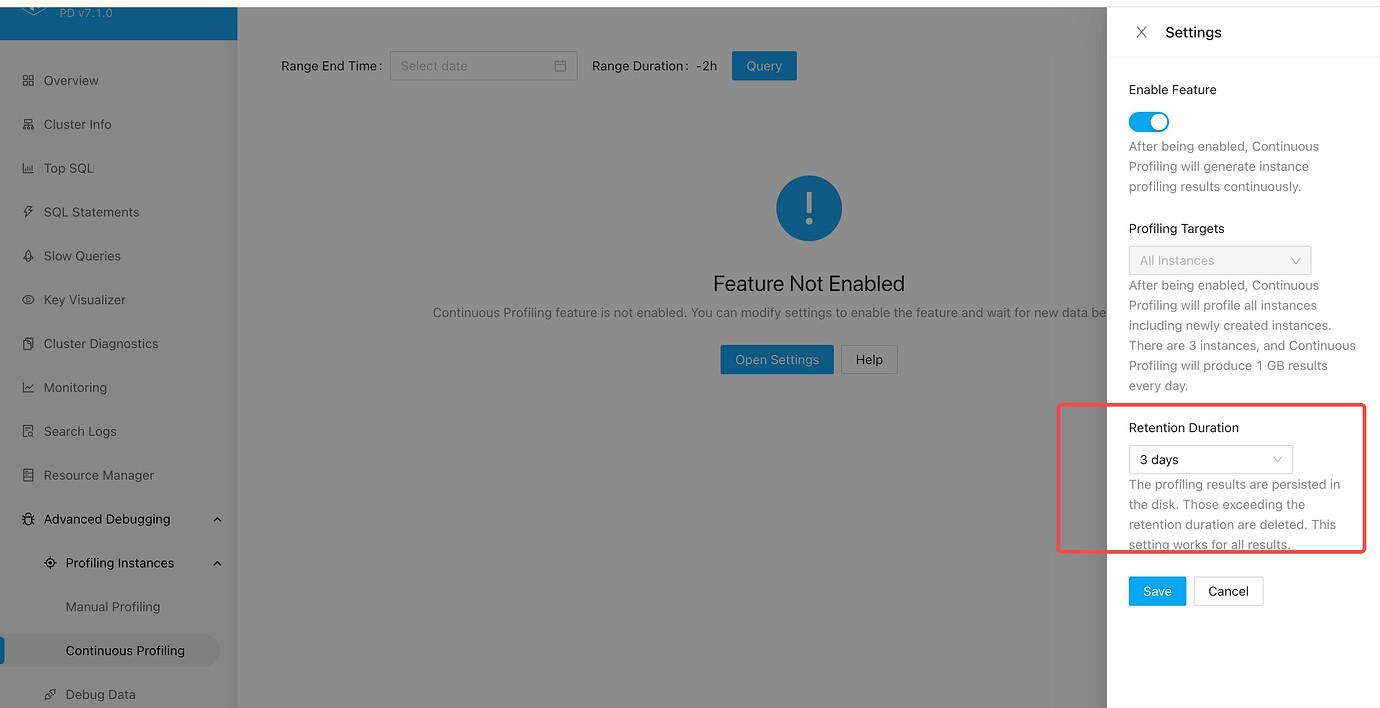
ng-monitoring mainly includes two features: topsql and continuous profiling. Topsql data exceeding one month will be recycled by default, and this cannot be configured for now. Continuous profiling can be configured, with a default of 3 days:
Continuous profiling occupies relatively more space, and you can delete docdb to alleviate this (also, in version 6.1, conprof is enabled by default. If you delete docdb, the switch will reset to the default value. If you want to turn off conprof to save disk space, remember to check the dashboard to ensure the switch is off after deleting docdb).
You can delete it directly.
Listen to everyone, delete it.
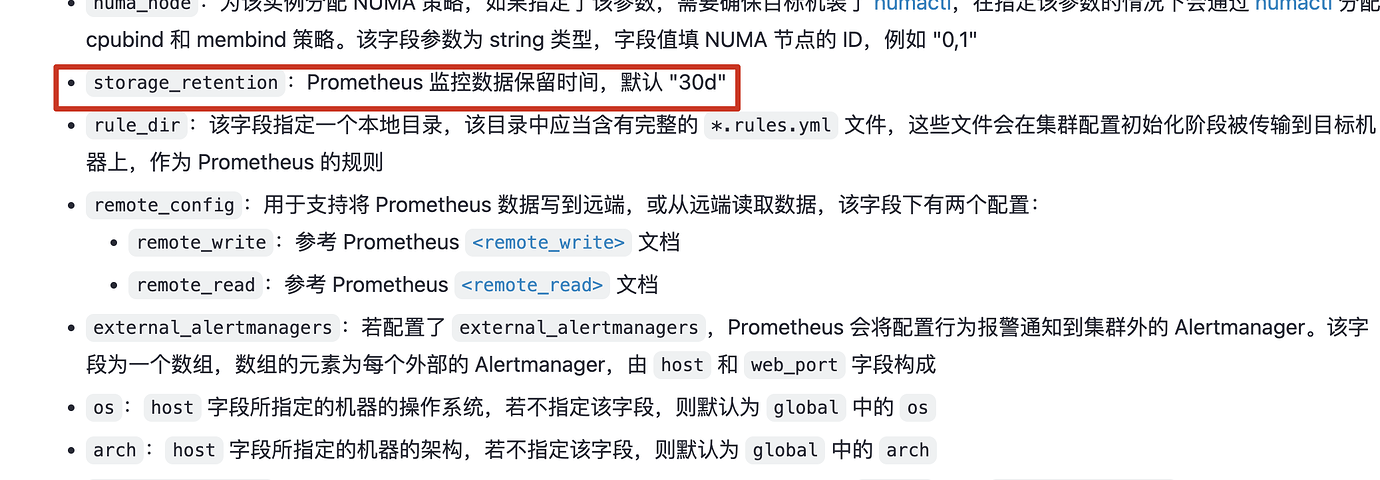
The logs of Prometheus can be modified through storage_retention. You can refer to the documentation; actually, there are many customizable options. 通过 TiUP 部署 TiDB 集群的拓扑文件配置 | PingCAP 文档中心
Another major part is the logs generated by TopSQL and continuous profiling. You can refer to Edwin’s answer and make modifications through the dashboard page.
This topic was automatically closed 60 days after the last reply. New replies are no longer allowed.