Note:
This topic has been translated from a Chinese forum by GPT and might contain errors.
Original topic: TiDB执行在并发情况下sql执行时间比较长
【TiDB Usage Environment】Production Environment
【TiDB Version】7.2
【Reproduction Path】SQL execution time exceeds 10 seconds under approximately 1000 concurrent requests
【Encountered Problem: Phenomenon and Impact】
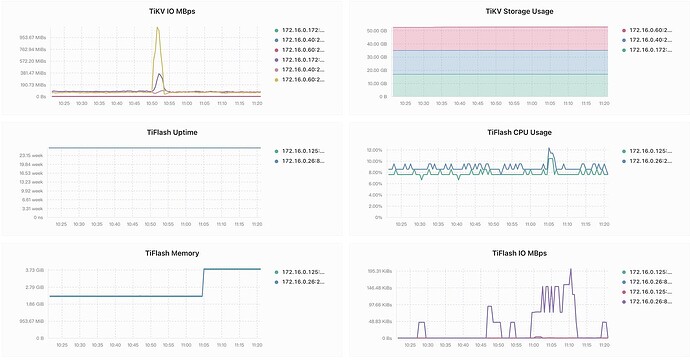
Currently, due to the long SQL execution time, the concurrency level does not meet the expected value. Therefore, I am requesting help from experts. Information is as shown in the image below.
【Resource Configuration】
【Attachments: Screenshots/Logs/Monitoring】
- I don’t know when your peak concurrency time is. Is it during the peak period shown in the monitoring graph? If so, looking at your TiDB and TiKV individual nodes, the CPU usage reached 400% and 800% respectively. Additionally, some TiKV nodes have higher IO. You might want to consider the issue of data hotspots and also pay attention to whether there are bottlenecks in CPU and disk IO during high concurrency periods.
- What is the high-concurrency operation? Is it read or write? Is that SQL statement a high-concurrency query?
Additionally, 7.2 is not an LTS version. It is recommended to use an LTS version.
1000 concurrent requests? How is your TiDB configured, what type of SQL are you running, what is the cluster resource usage like, and are the read thread pools of TiKV currently maxed out?
Thank you very much for your response.
-
The high concurrency is the peak value in the monitoring graph. The resources in the monitoring have not reached the bottleneck of our server. We are also considering generating a calculation report based on the screenshot to apply for server resources from the higher department if it is indeed the bottleneck of server resources. However, since the server bottleneck has not been reached yet, we are unsure how to optimize this issue. We are wondering if there are any optimization configurations, such as thread pools.
-
The high concurrency is a read operation (
SELECT
xxx_id
FROM
tb_xxxx
WHERE
(
xx_id = 1658553
AND xxx_type = ‘st’
AND xx_state = 0
AND valid_time > ‘2024-01-18 10:49:51.242’
);
We will be upgrading to version 7.5 soon.
Where can the read thread pool you mentioned be monitored or configured?
The cluster setup is a bit strange. Why are TiDB and TiFlash nodes placed on the same machine, and this machine has less memory? TiFlash itself is quite memory-intensive, so wouldn’t this make it more likely for TiDB to run out of memory and cause OOM more easily?
You can check whether the execution plan of the SQL has changed and whether the execution plan is consistent under high concurrency and low concurrency.
Oh, yes, it’s my first time using TiDB and there are many things I haven’t figured out yet. I’m still learning. Later, we will reallocate based on the test report.
The execution plans for high concurrency and low concurrency are the same.
Execution plan under low concurrency:
Execution plan under high concurrency:
Specific situations require specific good examples.
It is normal for concurrent execution to take a long time. You need to check for conflicts in concurrency, whether the SQL is using appropriate indexes, and whether there are any unreasonable large transactions.
It is recommended to check the index.
Take a look at the SQL execution plan to see if it uses the index. You can set the concurrency to 500 and see the effect.
Check the read thread configuration of TiKV.
It’s still a matter of insufficient resources. It would be better to separate PD, TiDB server, and TiFlash.


