TiDB Frequently Experiences Jitter

Note:
This topic has been translated from a Chinese forum by GPT and might contain errors.

Original topic: tidb经常抖动

| username: tug_twf

[TiDB Usage Environment] Production Environment
[TiDB Version] 6.1.6
[Reproduction Path] Operations performed that led to the issue
[Encountered Issue: Phenomenon and Impact]
TiDB frequently experiences query jitter, usually accompanied by the following situation during jitter:

Looking at one of the slower time points, it points to a TiKV. From the TiKV logs, it appears that raft-related synchronization stalling is causing the slowness.

Raft-related latency is indeed quite high.

Then, I adjusted the raftstore.store-io-pool-size parameter, but it had no effect.

Observed two strange phenomena:

  1. TiKV’s block cache hit rate is very low, unlike other clusters, as shown below:

  2. Raft CPU consistently jitters, and the SQL jitter coincides with this CPU jitter, occurring every 10 minutes.
    image

Regarding the 10-minute fluctuation, I tried stopping the 10-minute statistics for raft and rocksdb, as well as other parameters, but it had no effect.

[Resource Configuration] Go to TiDB Dashboard - Cluster Info - Hosts and take a screenshot of this page
[Attachments: Screenshots/Logs/Monitoring]

| username: Anna | Original post link

My first reaction is, are you saying that the IO is full? Check the disk read and write.

| username: Anna | Original post link

Optimization for Performance Jitter Caused by Incomplete Scheduling Functionality or I/O Throttling

During TiDB scheduling, resources such as I/O, Network, CPU, and Memory are consumed. If scheduling tasks are not controlled, QPS and latency may experience performance jitter due to resource contention. Through the following optimizations, long-term testing for 72 hours showed that the standard deviation of Sysbench TPS jitter decreased from 11.09% to 3.36%.

  • Reduce scheduling caused by the total capacity of nodes fluctuating near the waterline and the store-limit configuration of PD being set too high. Introduce a new scheduling scoring formula and enable it through the region-score-formula-version = v2 configuration item #3269.
  • Enable cross-Region merge functionality by setting enable-cross-table-merge = true, reducing the number of empty Regions #3129.
  • TiKV’s background data compression consumes a large amount of I/O resources. The system automatically adjusts the compression speed to balance the contention for I/O resources between background tasks and frontend data read/write operations. Enabling this feature through the rate-limiter-auto-tuned configuration item significantly reduces latency jitter compared to when the feature is not enabled #18011.
  • During TiKV’s garbage data collection and data compression, partitions consume CPU and I/O resources, and there is data overlap during these two tasks. The GC Compaction Filter feature combines these two tasks into one, reducing I/O consumption. This feature is experimental and can be enabled through gc.enable-compaction-filter = true #18009.
  • TiFlash’s data compression or organization consumes a large amount of I/O resources. The system alleviates resource contention by limiting the I/O amount used for compression or data organization. This feature is experimental and can be enabled through the bg_task_io_rate_limit configuration item.
| username: Anna | Original post link

Optimize Performance Jitter Caused by Incomplete Scheduling Functionality

#18005

During the scheduling process, TiDB consumes resources such as I/O, network, CPU, and memory. If the scheduling tasks are not controlled, QPS and latency may experience performance jitter due to resource contention.

Through the following optimizations, an 8-hour test showed that the standard deviation of tpm-C jitter in the TPC-C test was less than or equal to 2%.

Introduce a New Scheduling Scoring Formula to Reduce Unnecessary Scheduling and Performance Jitter

When the total capacity of a node frequently fluctuates around the system’s set watermark or the store-limit configuration is set too high, the system will frequently schedule Regions to other nodes to meet capacity load design, even scheduling back to the original node. This process consumes I/O, network, CPU, and memory resources, causing performance jitter, but such scheduling is often unnecessary.

To alleviate this issue, PD introduces a new scheduling scoring formula, enabled by default. You can switch back to the previous formula using the region-score-formula-version = v1 configuration.

Enable Cross-Table Region Merge by Default

User Documentation

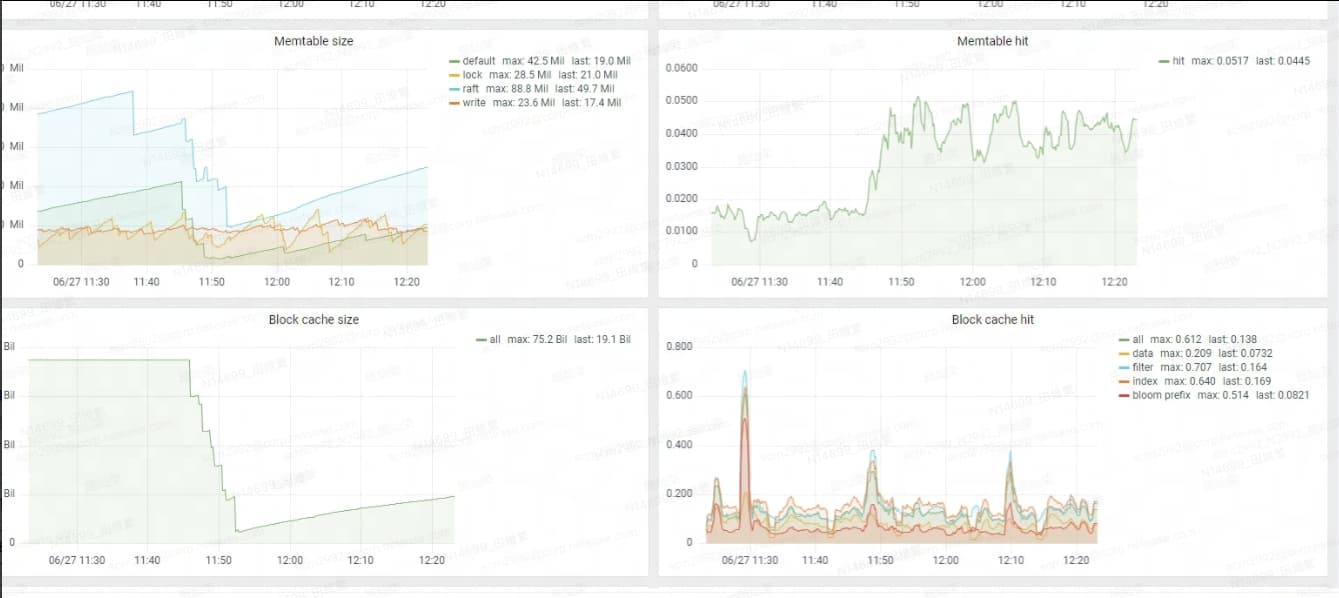
Before version 5.0, TiDB disabled the cross-table Region merge feature by default. Starting from version 5.0, TiDB enables this feature by default to reduce the number of empty Regions and lower the system’s network, memory, and CPU overhead. You can disable this feature by modifying the schedule.enable-cross-table-merge configuration.

Enable Auto-Tuning of Compaction Speed by Default to Balance I/O Resource Contention Between Background Tasks and Front-End Data Reads/Writes

User Documentation

Before version 5.0, the feature to auto-tune Compaction speed to balance I/O resource contention between background tasks and front-end data reads/writes was disabled by default. Starting from version 5.0, TiDB enables this feature by default and optimizes the adjustment algorithm. Enabling this feature significantly reduces latency jitter compared to when it is disabled.

You can disable this feature by modifying the rate-limiter-auto-tuned configuration.

Enable GC in Compaction Filter by Default to Reduce CPU and I/O Resource Usage by GC

User Documentation, #18009

During garbage collection and data Compaction, TiDB partitions consume CPU and I/O resources, and there is data overlap during these tasks.

The GC Compaction Filter feature combines these two tasks into one, reducing CPU and I/O resource usage. This feature is enabled by default, but you can disable it by setting gc.enable-compaction-filter = false.

TiFlash Limits I/O Resource Usage for Compression or Data Organization (Experimental Feature)

This feature alleviates I/O resource contention between background tasks and front-end data reads/writes.

This feature is disabled by default. You can enable it by configuring bg_task_io_rate_limit to limit I/O resource usage for compression or data organization.

Enhance Performance of Scheduling Constraint Checks to Improve Performance of Repairing Unhealthy Regions in Large Clusters

| username: tug_twf | Original post link

The throughput is very low, just using DM to synchronize a few tables and then performing simple queries. Occasionally, there are lags, and the usage rate is also very low. I suspect it is still related to CPU jitter affecting Raft.

| username: xfworld | Original post link

Two guesses:

  • Insufficient configuration, unable to meet the usage scenario

  • Sudden hotspot writes, leading to flow control protection, making it appear very slow in response

Pure speculation… :rofl:

| username: tug_twf | Original post link

These have all been optimized.

| username: 有猫万事足 | Original post link

If it jumps regularly every 10 minutes, I would suspect it is caused by GC. You can check if the GC runtime matches up with the issue. If it is confirmed that the slow write of this TiKV is caused by GC, it would be more reasonable to suspect if there is a problem with the disk. This is because other TiKVs also have GC at the same time but do not encounter issues like this TiKV. Compare the ops and write byte volume of this TiKV with other TiKVs. If there are no significant differences, it is more likely that this disk is simply slower.

| username: tug_twf | Original post link

Yes, I also suspected the disk, but other TiKV instances have the same issue. It was this TiKV at that time, and other TiKV instances at other times, so it shouldn’t be a disk problem.
I also suspected the GC time before, but I didn’t make any adjustments.

| username: zhanggame1 | Original post link

Adjust the GC time and see if it is caused by GC.

| username: h5n1 | Original post link

What type of CPU is it, and has the power-saving mode been turned off? Check the network monitoring. You can look at it from black exporter and node exporter.

| username: tug_twf | Original post link

It doesn’t have much to do with GC either. Adjusted it, still has issues.

| username: zhanggame1 | Original post link

Both tikv_gc_run_interval and tikv_gc_life_time have been changed, with the first one being more relevant.

| username: 有猫万事足 | Original post link

The troubleshooting ideas in the above documents are quite clear. I think you can carefully compare and investigate.

By the way, take a look at this chart and check which part is slow.

| username: ffeenn | Original post link

This symptom is basically related to IO.

| username: Anna | Original post link

Is it resolved?
What’s the issue?

| username: redgame | Original post link

A shake is a capital occurrence.