Note:
This topic has been translated from a Chinese forum by GPT and might contain errors.
Original topic: tidb产生过多执行计划
v7.4.0
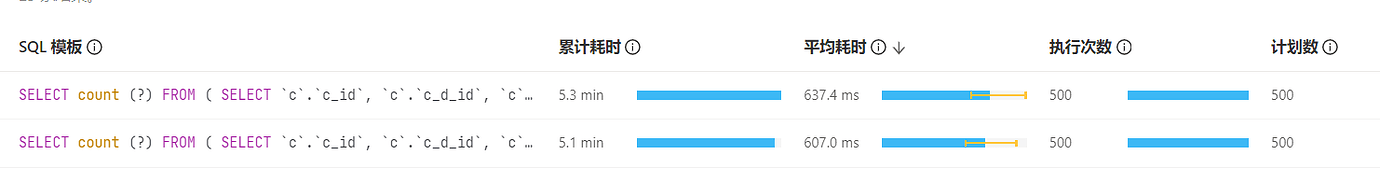
During the initialization of data with tiup bench tpcc(500 warehouse), it was found that there were slow SQL queries on the dashboard, with over 500 execution plans.
select count ( ? ) from ( select `c` . `c_id` , `c` . `c_d_id` , `c` . `c_w_id` , `c` . `c_balance` `c1` , ( select sum ( `ol_amount` ) from `orders` , `order_line` where `ol_w_id` = `o_w_id` and `ol_d_id` = `o_d_id` and `ol_o_id` = `o_id` and `ol_delivery_d` is not ? and `o_w_id` = ? and `o_d_id` = `c` . `c_d_id` and `o_c_id` = `c` . `c_id` ) `sm` , ( select sum ( `h_amount` ) from history where `h_c_w_id` = ? and `h_c_d_id` = `c` . `c_d_id` and `h_c_id` = `c` . `c_id` ) `smh` from `customer` `c` where `c` . `c_w_id` = ? ) `t` where `c1` <> `sm` - `smh`
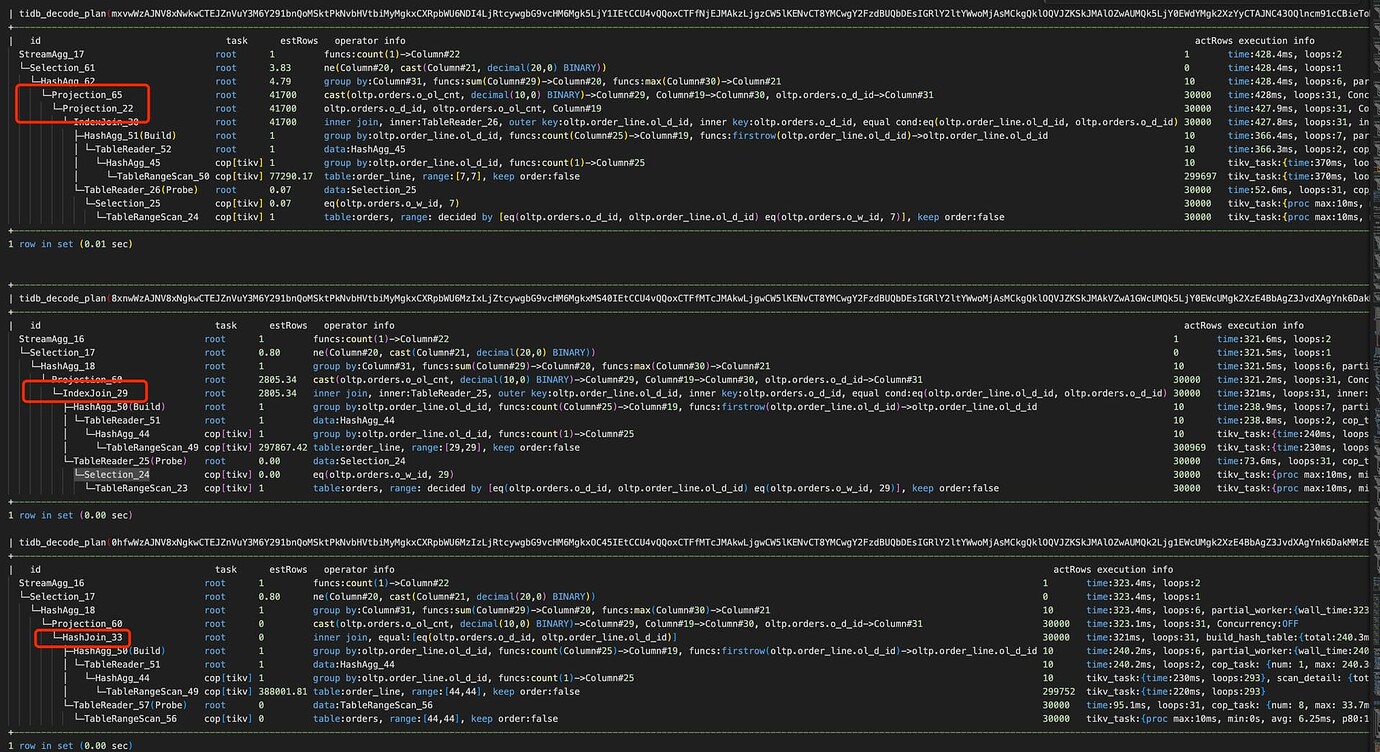
Is there any difference in the SQL text that generates these different plans? Can you provide the plan text for any two of them?
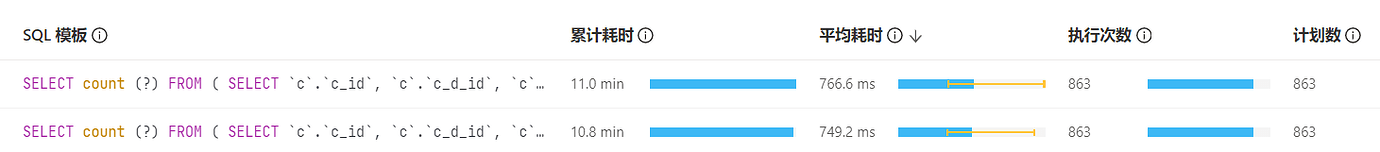
I reinitialized 1000 warehouses, and the execution plans for the two SQLs are as follows:
Can you extract two complete slow query logs for this SQL?
select count ( ? ) from ( select `c` . `c_id` , `c` . `c_d_id` , `c` . `c_w_id` , `c` . `c_balance` `c1` , ( select sum ( `ol_amount` ) from `orders` , `order_line` where `ol_w_id` = `o_w_id` and `ol_d_id` = `o_d_id` and `ol_o_id` = `o_id` and `ol_delivery_d` is not ? and `o_w_id` = ? and `o_d_id` = `c` . `c_d_id` and `o_c_id` = `c` . `c_id` ) `sm` , ( select sum ( `h_amount` ) from history where `h_c_w_id` = ? and `h_c_d_id` = `c` . `c_d_id` and `h_c_id` = `c` . `c_id` ) `smh` from `customer` `c` where `c` . `c_w_id` = ? ) `t` where `c1` <> `sm` - `smh`
The same SQL has over 500 execution plans? That looks a bit scary.
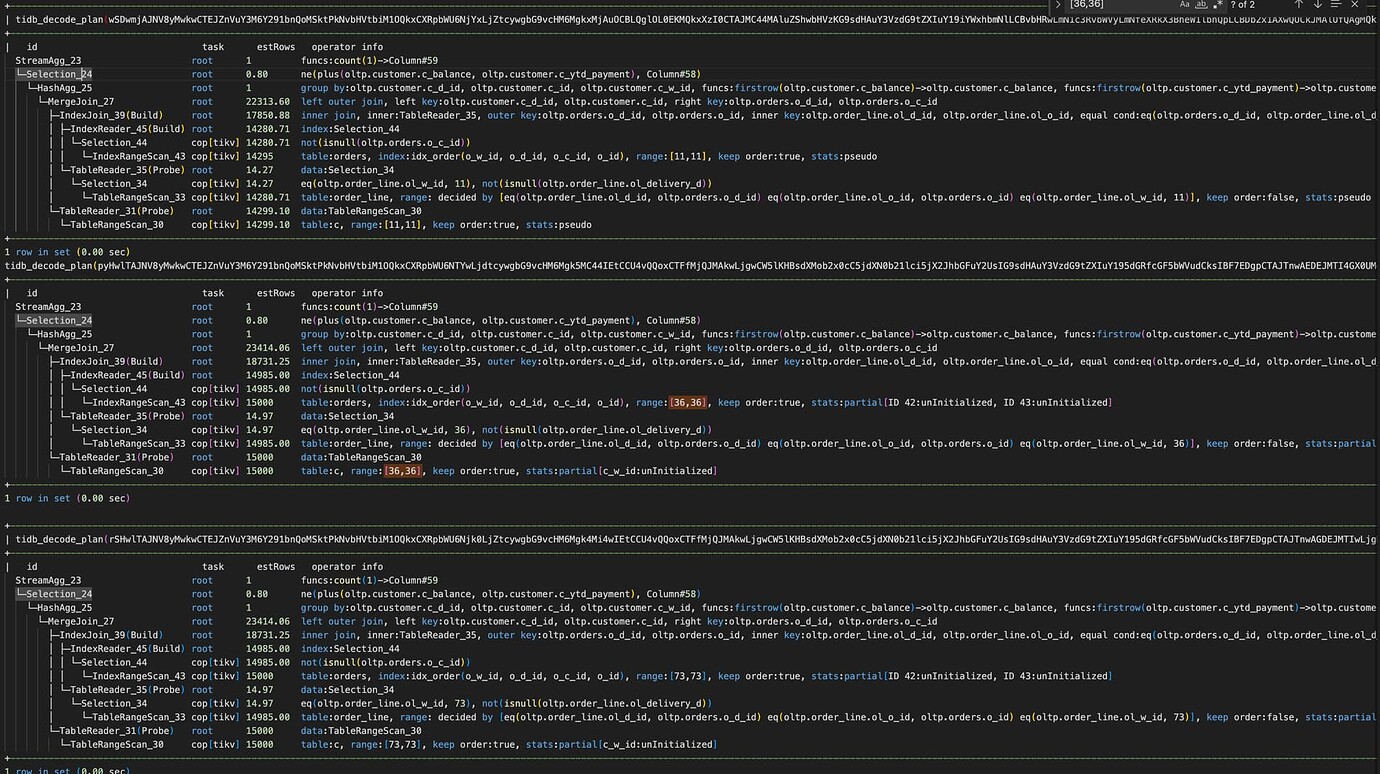
Plandigest is divided into two different situations: one is that the operators are indeed inconsistent, and the other is that the operators are consistent but the plandigest is inconsistent. This requires further investigation to find the root cause.
The index join probe side uses predicate conditions and join keys together to filter data. In this case, the index range scan operator did not replace the predicate condition with ?, resulting in different plan digests. Thanks for the feedback, the fix should be included in the next version.
This topic was automatically closed 60 days after the last reply. New replies are no longer allowed.