Note:
This topic has been translated from a Chinese forum by GPT and might contain errors.
Original topic: tidb 分组查询慢
[TiDB Usage Environment] Production Environment
[TiDB Version] 6.1.2
[Reproduction Path] Operations performed that led to the issue
[Encountered Issue: Problem Phenomenon and Impact]
The same SQL takes 0.7s to execute in MySQL but takes 1min+ in TiDB.
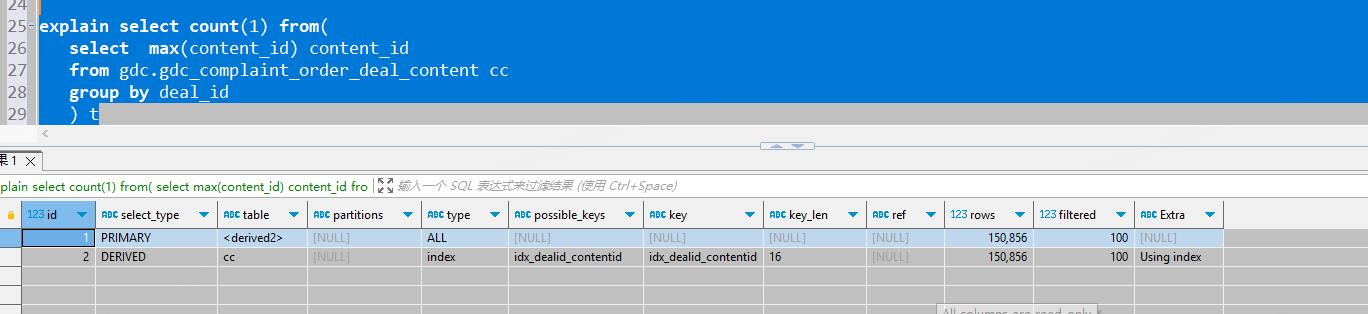
select count(1) from(
   select  max(content_id) content_id
   from gdc.gdc_complaint_order_deal_content cc
   group by deal_id
   ) t
TiDB execution plan:
MySQL execution plan:
[Resource Configuration]
Check the resource usage of TiKV.
count(1) will scan the entire table if there is no index, while count(*) will use the primary key index, etc.
What is your resource configuration and what type of disk are you using?
How many rows of data? 0.7s
Take a look at whether the DML operations on this table are a bit too frequent. See what happens after stopping the application.
Using TiFlash, this is a single column.
If queries become slow, first check the health of the table.
It depends on the total amount of your table data. If possible, filter it first and then group it.
Is the data volume in TiDB the same as in MySQL?
It seems that the estimated rows in the execution plans of the two are quite different.
I recommend using the TiFlash component; the columnar storage speed is amazing.
Try replacing EXPLAIN with EXPLAIN ANALYZE in TiDB.
explain analyze to see the number of keys scanned
Is the data in TiDB consistent with MySQL? I see that there are 150,856 rows in MySQL, but 990,310 in TiDB.
If they are consistent, try running ANALYZE TABLE to collect statistics.
When you see that the root of the entire plan is the hashagg operator in the TiDB execution plan, the best solution is TiFlash + MPP.
It can be observed that when TiDB executes this SQL, it first performs an aggregation on TiKV. However, because the data is stored in a distributed manner, the aggregation results on each TiKV inevitably need to be aggregated again on TiDB. This is unlike the single-machine storage scenario where a single aggregation can directly yield the result.
Well, let’s take a look at the actual execution plan.
This SQL is adapted for the TiFlash scenario. Add a TiFlash node and set a TiFlash replica for the table gdc_complaint_order_deal_content. This SQL will absolutely fly…
Can the SQL be changed to this?
SELECT COUNT(DISTINCT deal_id)
FROM gdc.gdc_complaint_order_deal_content cc;
Setting up TiFlash is indeed fast, but why is TiKV so much slower? I feel puzzled.
Use EXPLAIN ANALYZE to check the execution plan and see where the slowdown is. I have encountered this issue with TiDB when writing complex SQL, especially when using GROUP BY and MAX together.
Try running EXPLAIN ANALYZE on this SQL and post the execution plan. This is essentially an OLAP-type SQL. If you don’t have a composite index on content_id and deal_id, it will be even slower. Even with the index, it will perform a full index scan. The SQL first pushes down to all corresponding TiKV nodes, retrieves the largest content_id corresponding to each deal_id on each TiKV node, then the TiDB server aggregates the largest content_id corresponding to each deal_id returned by all TiKV nodes. If multiple nodes return the largest content_id corresponding to the same deal_id, it needs to select the largest content_id corresponding to the same deal_id from these multiple records. Finally, it returns the largest content_id corresponding to a single deal_id and performs a count aggregation, which is definitely slow.
Looking at the execution plan, there doesn’t seem to be any issues. You should use EXPLAIN ANALYZE to actually execute it and see what the real execution plan looks like.
You can use explain analyze to see where exactly this 1-minute delay is occurring.