[TiDB Usage Environment] Production Environment
[TiDB Version] 7.1.0
[Reproduction Path]
[Encountered Problem: Phenomenon and Impact]
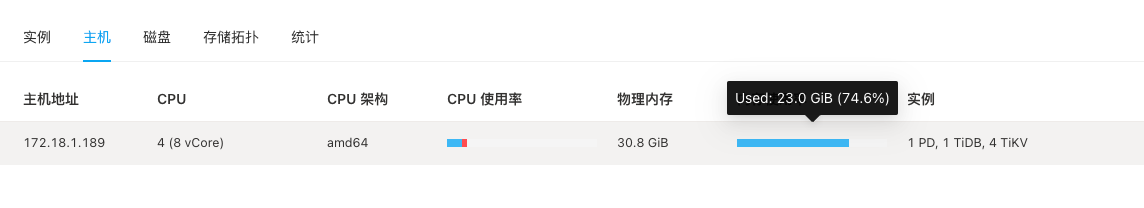
When the root user executes SHOW FULL PROCESSLIST, it is found that no SQL is being executed, but the dashboard shows that 20G of memory is already used.
[Resource Configuration]
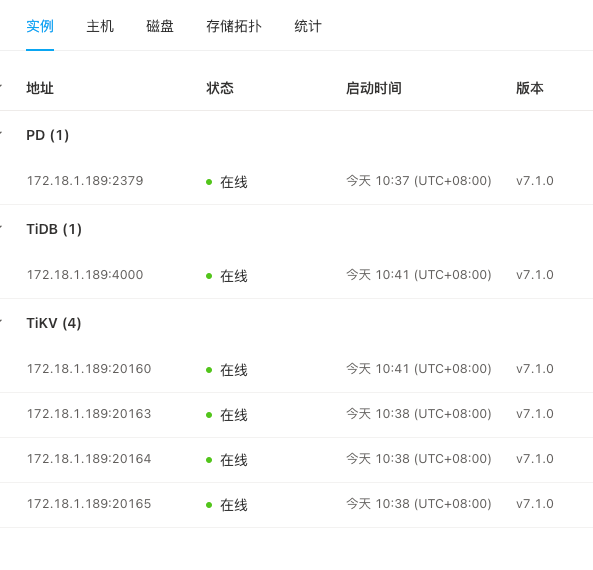
Uh, with 1 PD, 1 TiDB, and 4 TiKV sharing 30GB of memory, even without running anything, the system processes alone would probably take up around 20GB of memory…
Currently, the data volume is relatively small, so it’s being used as a single-machine MySQL. Later, when the data volume increases, it might expand. Using TiDB is convenient for scaling. How can it be optimized?
What I meant by “didn’t do anything” was that I executed SHOW FULL PROCESSLIST as the root user and found that there were no SQL queries being executed. It might be understood differently depending on the role.
After running for a period of time, although the load is not high, I recently noticed frequent high memory warnings followed by restarts. Today, after a restart, I observed that the memory usage was already at 20G even without any SQL operations running.
How much data is inside? TiKV sometimes has high memory usage, and it might be that your memory has reached its threshold; otherwise, it could be even more.
There are several parameters that need to be adjusted for hybrid deployment.
If you haven’t adjusted them, TiKV will assume it is exclusively using the machine. It will use the resources but won’t release them.
I just think your problem might not be about memory not being released, but rather the overall stability of the entire cluster. It might be more serious than you described.