Note:
This topic has been translated from a Chinese forum by GPT and might contain errors.
Original topic: tidb层 PD TSO Wait Duration 999指标达到了 20 ms级别
【TiDB Environment】Production
【TiDB Version】5.3.1
【Encountered Problem】
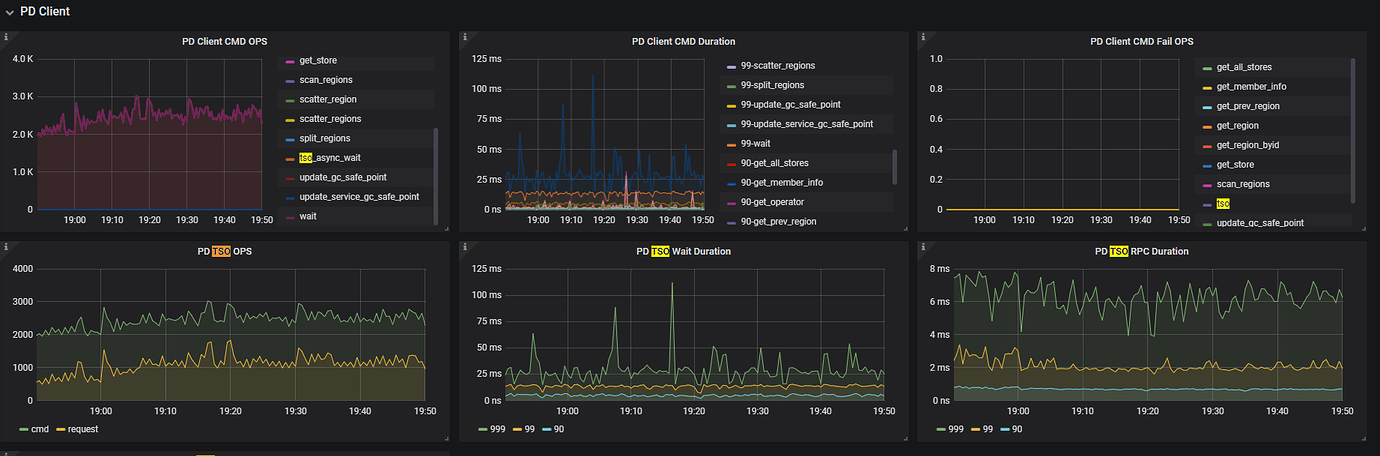
PD latency
PD itself processes very quickly
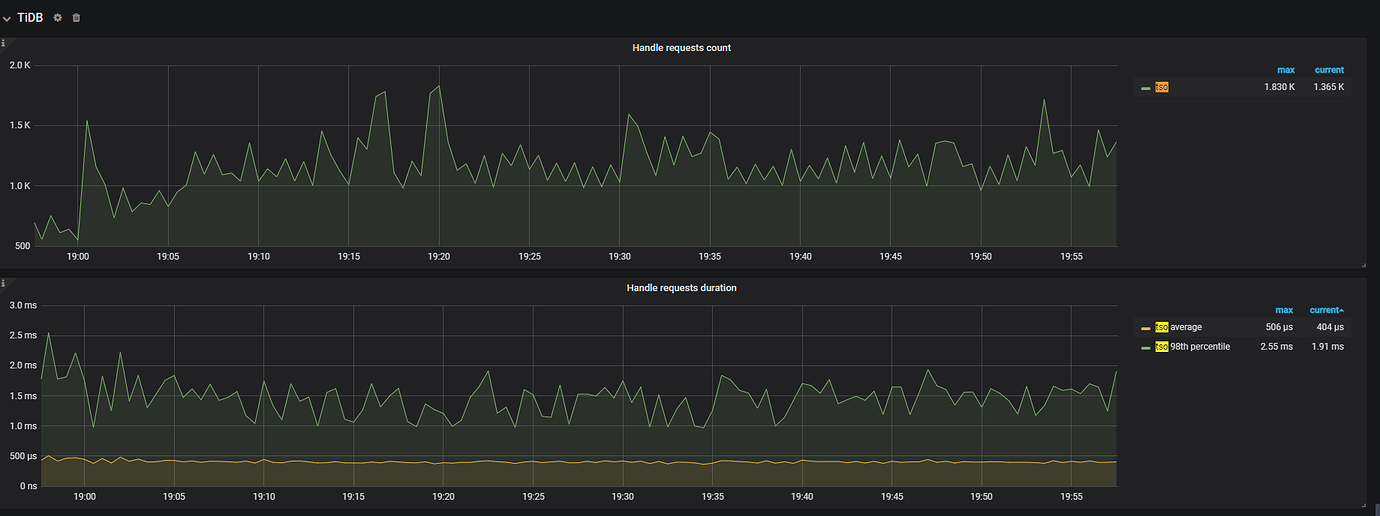
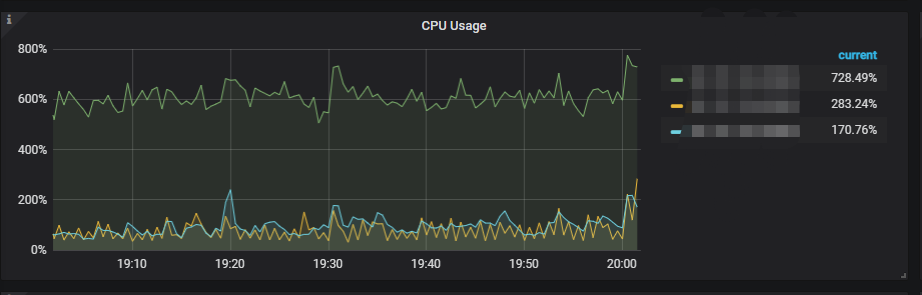
TiDB layer CPU imbalance
What is the blue line CMD above? It seems to have a peak.
After obtaining a TS (TSFuture) on the TiDB side, the wait time for calling its Wait method to get the TSO is the duration from “calling tsFuture.Wait() to getting the TSO result.”
When TiDB requests to generate a TSO, the PD Client does not block the caller but directly returns a TSFuture and handles the TSO request asynchronously in the background. Once completed, it immediately returns to the TSFuture. The holder of the TSFuture then needs to call Wait to get the final TSO result. At this point, there are two scenarios:
- If the TSO request has already been completed, Wait will immediately return an available TSO or an error.
- If the TSO request is not yet completed, Wait will block and wait for an available TSO or an error (indicating that the gRPC request is in transit and the network latency is high).
The PD TSO Wait Duration represents the total wait time from calling the Wait method to obtaining the TSO (excluding error cases). This may include the following durations (note the “may,” as it varies depending on the timing of calling Wait):
- TiDB side Go Runtime scheduling time (in most cases) --tidb cpu
- Part of the gRPC network latency
- Part of the PD side TSO generation processing time
- Part of the PD side Go Runtime scheduling time
It’s normal to have peaks. The various metrics and pressure of the database also fluctuate with the business requests. If it were really as calm as water, then a single MySQL instance would probably suffice.
TSO Wati is generally the time taken by TiDB to process after obtaining tsFuture.
Please provide guidance through other methods to balance TiDB’s connections and resources…
So that means it’s okay if this metric is a bit higher, right? It would be best if there were an official standard range.
This means that the TSO is slow because TiDB does not have more resources to handle this part, so it is slow.
By analyzing the delay in PD TSO processing and RPC network transmission, it can be determined that it is not a PD issue.
Whether this delay will affect the business is also one of the judgment criteria.
You suggest investigating from the TiDB side, right? We migrated data from 4.0 to 5.3.1, and the machine configurations are the same. Some metrics are slower, which is a bit strange, so I came here to ask.
The network and PD processing latency are relatively low, mainly on the TiDB side. Check the Async TSO Duration and parse compile latency of TiDB.
I didn’t see any corresponding metrics.
Hello, please provide the blackbox exporter monitoring dashboard, select the instance to the PD leader, and mark the IP of the TiDB-server node.