Note:
This topic has been translated from a Chinese forum by GPT and might contain errors.
Original topic: TiDB-Lightning导入数据卡住
【TiDB Usage Environment】Production
【TiDB Version】5.4
【Data Volume】800G, 3 TiDB nodes with 6 cores and 256G memory each, 4 KV nodes with the same configuration
【Reproduction Path】Stuck at the following log while using lightning for data recovery
【Problem Phenomenon and Impact】
[INFO] [pd.go:406] [“pause scheduler(configs)”] [name=“[balance-region-scheduler,balance-leader-scheduler,balance-hot-region-scheduler]”] [cfg=“{"enable-location-replacement":"false","leader-schedule-limit":40,"max-merge-region-keys":0,"max-merge-region-size":0,"max-pending-peer-count":2147483647,"max-snapshot-count":40,"region-schedule-limit":40}”]
I see that there is progress being made, why do you say it’s stuck?
Because this log has been stuck for 24 hours, and the total data is only 800GB.
Please follow the steps in this answer to check the go routines of Lightning and see where it is stuck.
The 800G data re-ran for a day and got stuck, then the restarted Lightning also got stuck.
Is the Lightning deployed on a separate server with 6 cores and 256G? It has already successfully imported several databases of 300G and 100G. Now it is importing the largest database of 800G. Can it be seen that the performance bottleneck is causing the issue?
Deleted the database and power-off files, then restarted lightning, but it still gets stuck. The logs are as follows: goroutine (1).log (335.2 KB) tidb-lightning.log.1 (299.5 KB)
I didn’t see any error information in the logs. Are there any monitoring items that have reached the threshold?
Currently, monitoring is not available due to internal restrictions. For now, you can only check through system commands. The import machine’s CPU has been at 100% continuously. Previously, it took 3 hours to successfully import a 300GB table. This 800GB table has already taken 16 hours and has been stuck for over ten hours.
The current tidb-lightning.toml only configures checkpoint resume, index-concurrency = 1, table-concurrency = 1, region-concurrency = 5, and everything else is the default standard configuration.
There is another problem, it is stuck now. If it is due to machine performance issues, what kind of scenario would cause it to be stuck in one place for more than 10 hours? After all, this configuration has successfully imported several 300G databases. Is there any other way to check where it is stuck?
Is it normal for it to always prompt “switch to import mode” after this? I feel like it shouldn’t be this way.
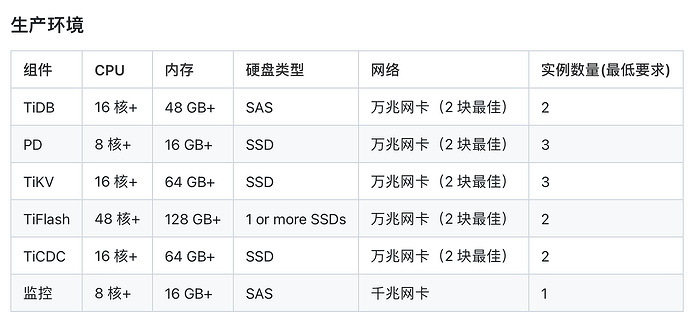
Communicated with the group owner. His machine has too few CPU cores and does not meet the minimum requirements. He needs to upgrade the hardware.
Has tidb-lightning exited abnormally, possibly causing the cluster to remain in import mode and leading to a CPU spike? You can try forcing it back to normal mode and see if that helps.
You can try importing in batches, one large table at a time. 
Resolved. There was an issue with the full data; a single SQL file exceeded 50GB, which might have caused problems during transmission. After replacing it, everything worked fine.

