Note:
This topic has been translated from a Chinese forum by GPT and might contain errors.
Original topic: TiDB内存一直在缓慢增涨
【TiDB Usage Environment】Production Environment
【TiDB Version】v4.0.2
【Reproduction Path】Operations performed that led to the issue
【Encountered Issue: Problem Phenomenon and Impact】
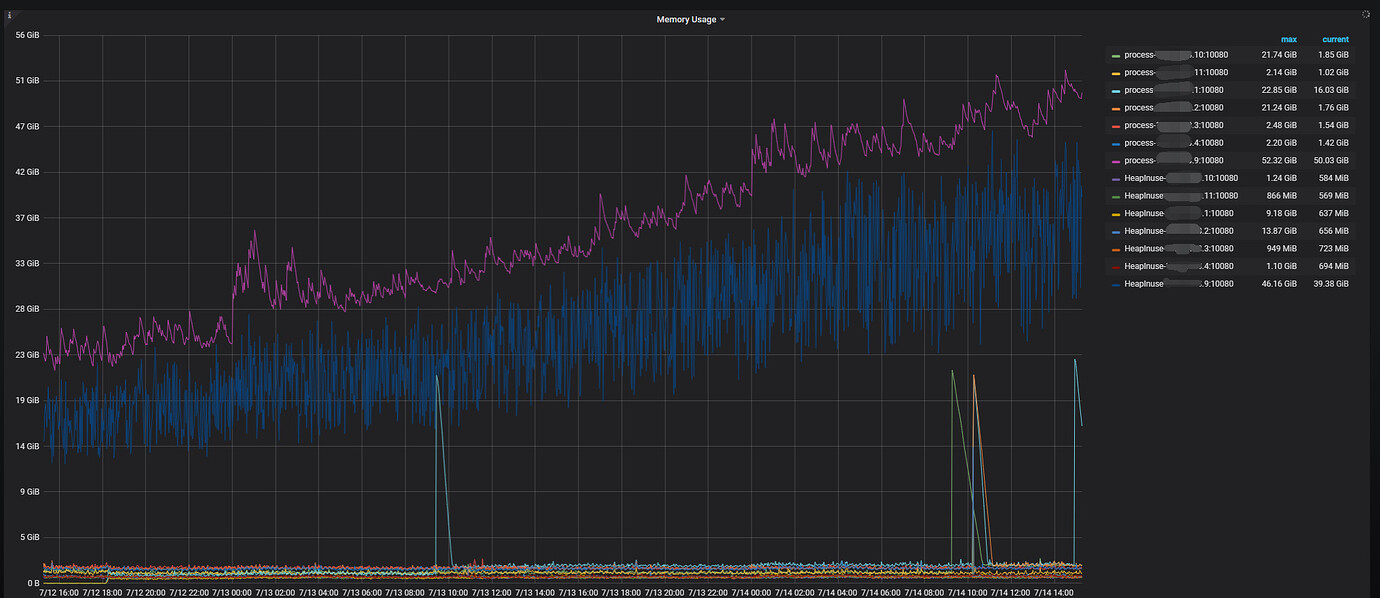
TiDB memory is continuously increasing slowly, and only one TiDB instance has high memory usage while the others have very low memory usage. All TiDB instances are load balanced through LVS, and the connection numbers are balanced.
【Resource Configuration】
【Attachments: Screenshots/Logs/Monitoring】
TiDB memory monitoring
Memory distribution of the high memory node
It’s quite an old version, hasn’t it been upgraded…
There are many reasons why TiDB doesn’t release long-term memory, the biggest one being slow queries. You can identify these queries through resource location and then solve them through optimization.
It wasn’t until version 6.X that some optimizations for OOM were properly done…
Is the goroutine count monitoring also increasing in the same way?
The goroutine count did not increase, and all nodes are about the same.
Can it be determined from memory distribution that it is caused by slow queries?
Check the query summary - CPS by instance and the KV request - KV request OPS monitoring to see if a particular node itself has a high number of requests.
I encountered this issue in version 5 before. I always suspected that it was caused by the dashboard’s slow SQL query feature. The larger the query range, the more memory a particular TiDB node uses, and it occasionally results in OOM. You can verify this.
I took a look at this, and the requests for this node are similar to those for other nodes.
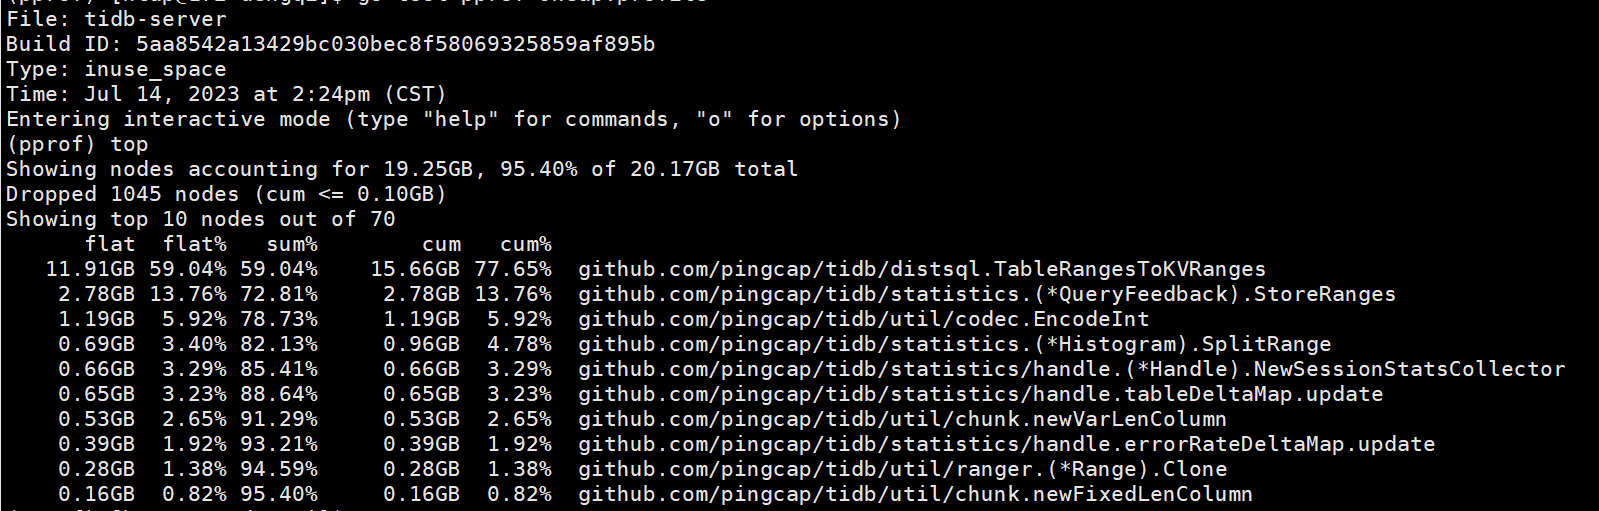
curl -G tidb_ip:port/debug/pprof/heap > heap.profile
Then use go tool pprof db.heap.prof → top command to see what is taking up the most.
This result has already been posted.
It still seems to be related to SQL, let’s take a look at slow SQL.
There are slow logs, and all nodes have them. The slow SQL on other nodes is not less than that on this node, but the memory of this node remains consistently high.
After investigation, we found that the node with high memory usage is the stats owner node. To avoid affecting the business, we restarted that node. However, the new stats owner also experienced continuous memory growth, which seems like a memory leak.
The version is a bit old, consider upgrading it.
Enable pprof and then analyze it to see where there is a leak.