[TiDB Usage Environment] Production Environment / Testing / PoC
[TiDB Version]
V5.0.0
[Reproduction Path] Operations performed that led to the issue
[Encountered Issue: Issue Phenomenon and Impact]
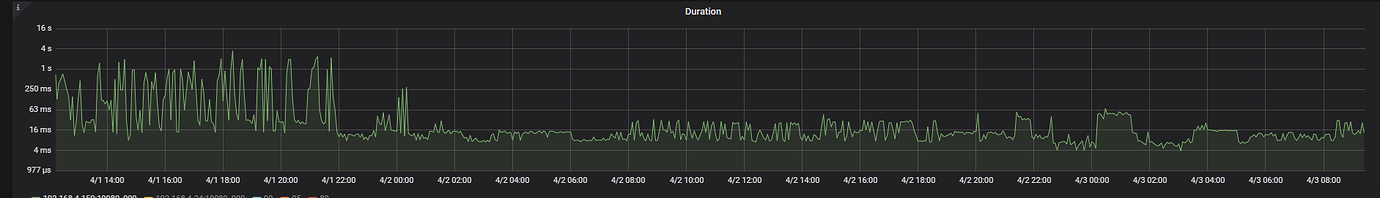
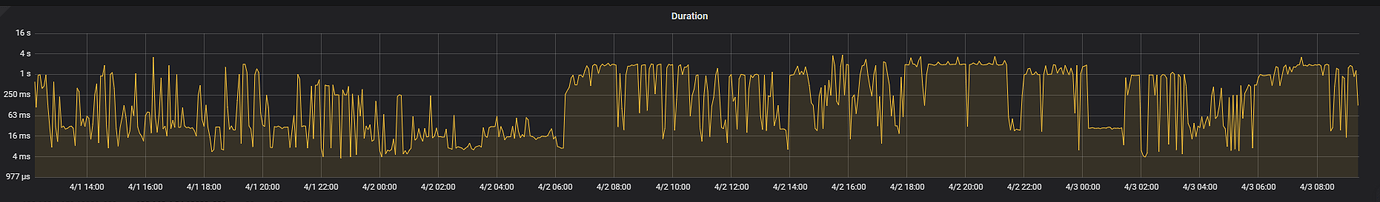
An issue occurred where business SQL that used to return in milliseconds now takes around 3 seconds. System query SQL is slow, with tp999 generally exceeding 2 seconds.
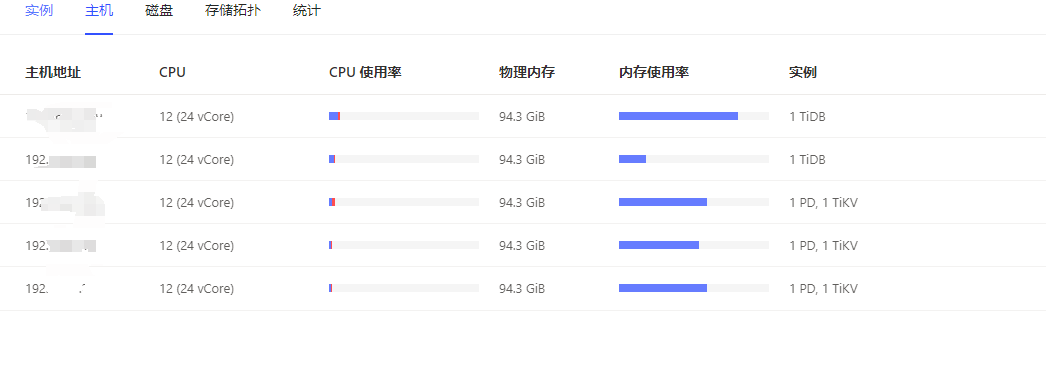
[Resource Configuration] Go to TiDB Dashboard - Cluster Info - Hosts and take a screenshot of this page
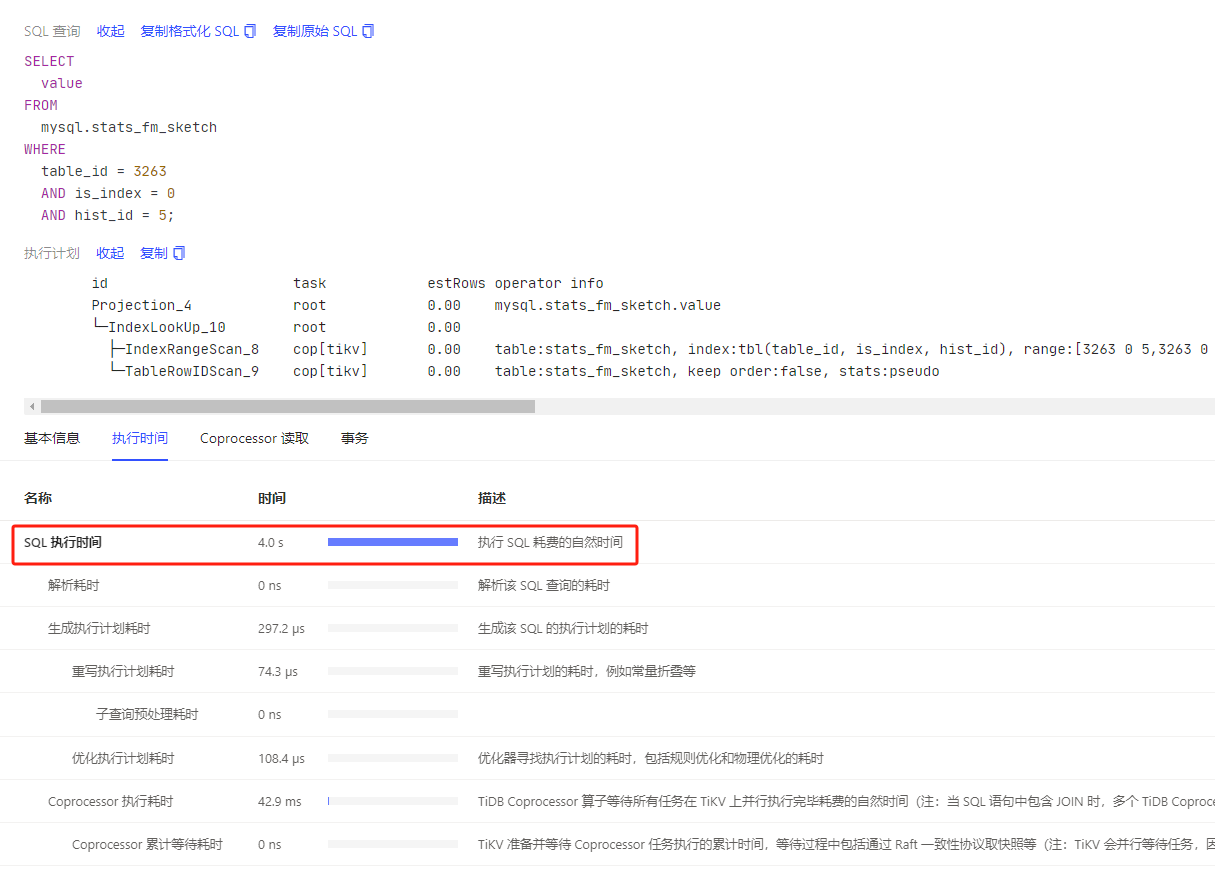
System table queries are slow, generally you don’t need to worry about it. I remember that higher versions have optimized this, so system table queries are slow.
Using HAProxy to load balance between two TiDB instances, I restarted one TiDB node the day before yesterday. The node that was restarted, tp999, became normal, but the other tp999 node that wasn’t restarted started having issues again. I’m wondering if the requests were redirected to the other node due to the restart, and the restart didn’t solve the problem.
Using the HAProxy configuration from the official documentation
listen tidb-cluster # Configure database load balancing.
bind 0.0.0.0:3306 # Floating IP and listening port.
mode tcp # HAProxy should use the 4th layer transport layer.
balance leastconn # The server with the fewest connections receives the connection first. leastconn is recommended for long-session services such as LDAP, SQL, TSE, etc., rather than short-session protocols like HTTP. This algorithm is dynamic, and the server weight will be adjusted during operation for slow-starting servers.
server tidb-1 192.168.1.2:4000 check inter 2000 rise 2 fall 3 # Check port 4000, with a check frequency of once every 2000 milliseconds. If 2 checks are successful, the server is considered available; if 3 checks fail, the server is considered unavailable.
server tidb-2 192.168.1.3:4000 check inter 2000 rise 2 fall 3
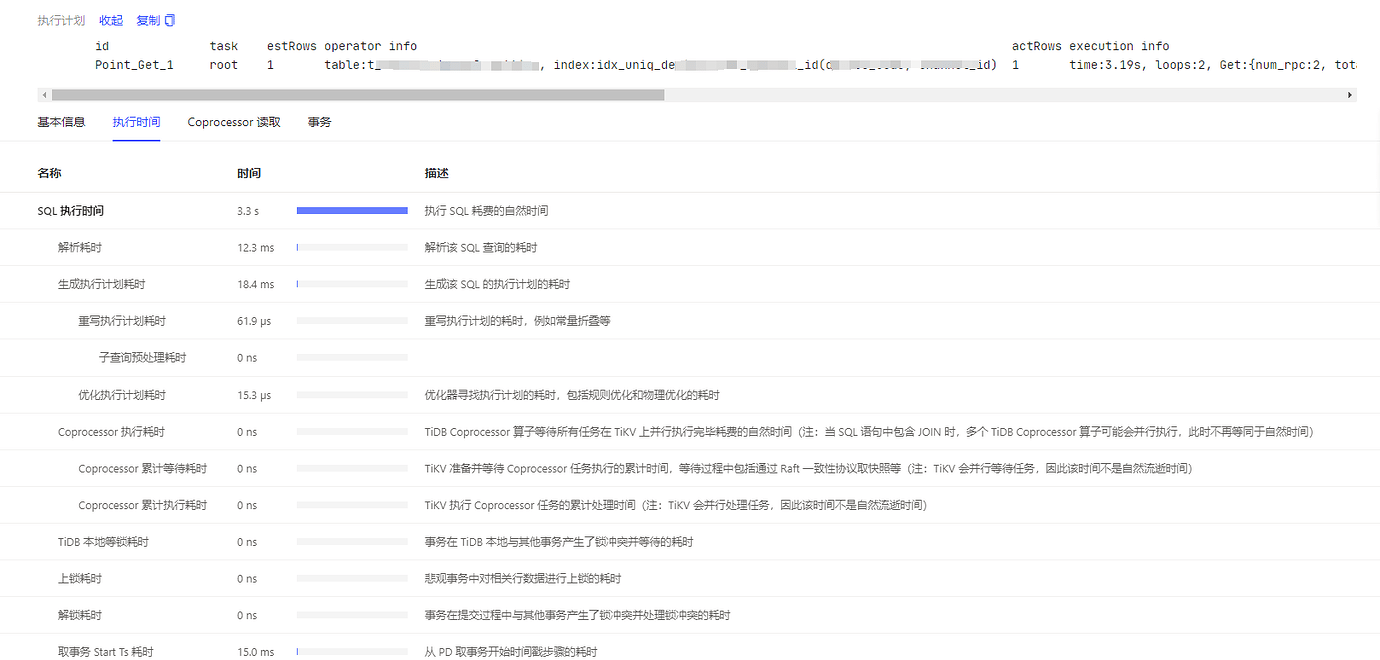
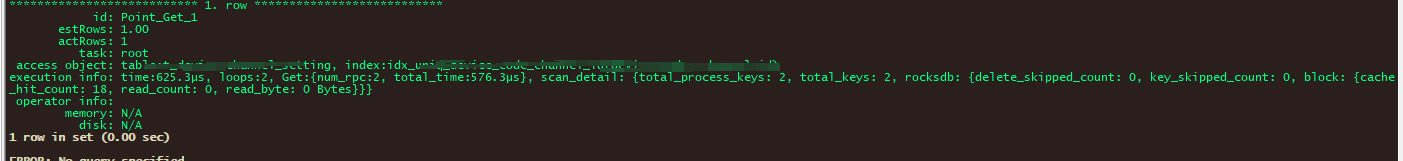
But from the execution plan of your SQL, it doesn’t seem to have any major issues. On which TiDB server did you execute this? You can find a slow SQL from the dashboard and then execute it on both TiDB servers separately to see if it’s a problem with the TiDB server.
There are other issues as well but they only occur occasionally. After restarting one of the tp999 over 2s alarms, the situation has somewhat improved.
Could you provide a more complete execution info of the business SQL’s execution plan? Then check if there is any significant time consumption in the coprocessor reads and transactions under the dashboard. Also, ensure that the statistics of your TiDB cluster are up-to-date and try executing analyze.
If it only happens occasionally, is it possible that it is caused by a sudden spike in traffic, creating a hotspot? You can analyze the pattern, check the specific business scenarios where the SQL is used, and conduct a detailed analysis.