Note:
This topic has been translated from a Chinese forum by GPT and might contain errors.
Original topic: tidb select * from information_schema.tables limit 1 查询无响应
[TiDB Usage Environment] Production Environment / Testing / Poc
[TiDB Version] V5.1.2
[Reproduction Path] What operations were performed that caused the issue
Referenced 统计信息简介 | PingCAP 文档中心 to modify configuration parameters, but the issue was not resolved
[Encountered Issue: Problem Phenomenon and Impact]
The query on this table is very slow, and when the user’s client connects, it often leads to no response and timeout
[Resource Configuration]
3TIDB + 3TiKV + 3PD
This database is a test database with a relatively large number of tables
[Attachments: Screenshots/Logs/Monitoring]
Execution plan of the statement
May I ask if there are any troubleshooting ideas that can be provided?
Try using trace select to see what results you get.
This will get stuck and cannot display any information.
Do we have a way to locate the cause of TiKV CPU anomalies through logs or to identify specific tables being read?
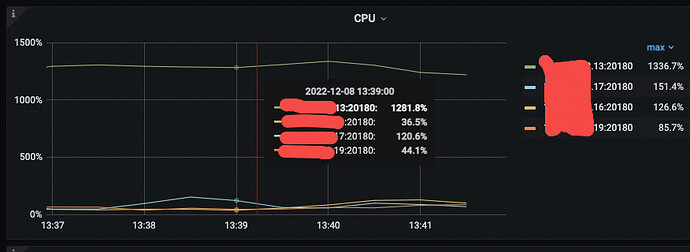
Is this exception only present when querying tables, or is it always present? You can first check the thread CPU utilization in the tikv-detail monitoring to see which type of thread has high CPU usage.
The high CPU anomaly has always been there, and I suspect it is related to the high CPU usage of TiKV. Checking the thread CPU did not reveal any particularly abnormal nodes.
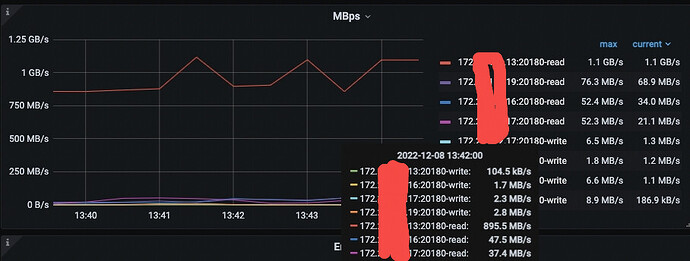
There is an obvious hotspot on this machine. Check the heatmap on the dashboard to see which object it is, and then look at the related slow SQL.
Confirmed that some large tables in the business are performing delete operations.
I encountered slow queries on system tables in Oracle before. It can be optimized by collecting system table statistics.
It seems that TiDB can’t do this. Manually collecting statistics on such mem tables will result in an error. 
ANALYZE table tables;
ERROR 1142 (42000): INSERT command denied to user 'root'@'%' for table 'tables'
May I ask: When I was troubleshooting the slowness of information_schema.tables, I noticed that querying this table triggers a region scan to determine the number of rows and index size. Where can I find detailed information about this part of the knowledge? 
I also couldn’t find the relevant description. Some metadata of the table is stored in TiKV, so it will scan some regions.
This table cannot be analyzed, I have also tried.
The information_schema.tables is actually not a table, but a system view. I think you should check if there are a lot of DDL operations being executed. When DDL operations are executed, they can actually affect the queries on this system view.
The business delete transaction has already stopped, but the CPU usage still hasn’t decreased.
The heatmap shows that the table reads are not that large.
Some truncate tasks are being executed in DDL.
Take a look at the slow SQL analysis on the dashboard, excluding delete operations.
Check the leader distribution in TiKV on the overview page.
Apart from delete operations, some tables in the business are read very frequently, and the table data volume is quite large. The auto-increment field used auto_increment, causing hotspot regions to concentrate on a single machine. The table has now been rectified, and TiDB performance has stabilized.
Thank you all for your suggestions.
This topic was automatically closed 60 days after the last reply. New replies are no longer allowed.


