Note:
This topic has been translated from a Chinese forum by GPT and might contain errors.
Original topic: tidb server计算节点内存在很短时间内被耗尽,反复自动重启。
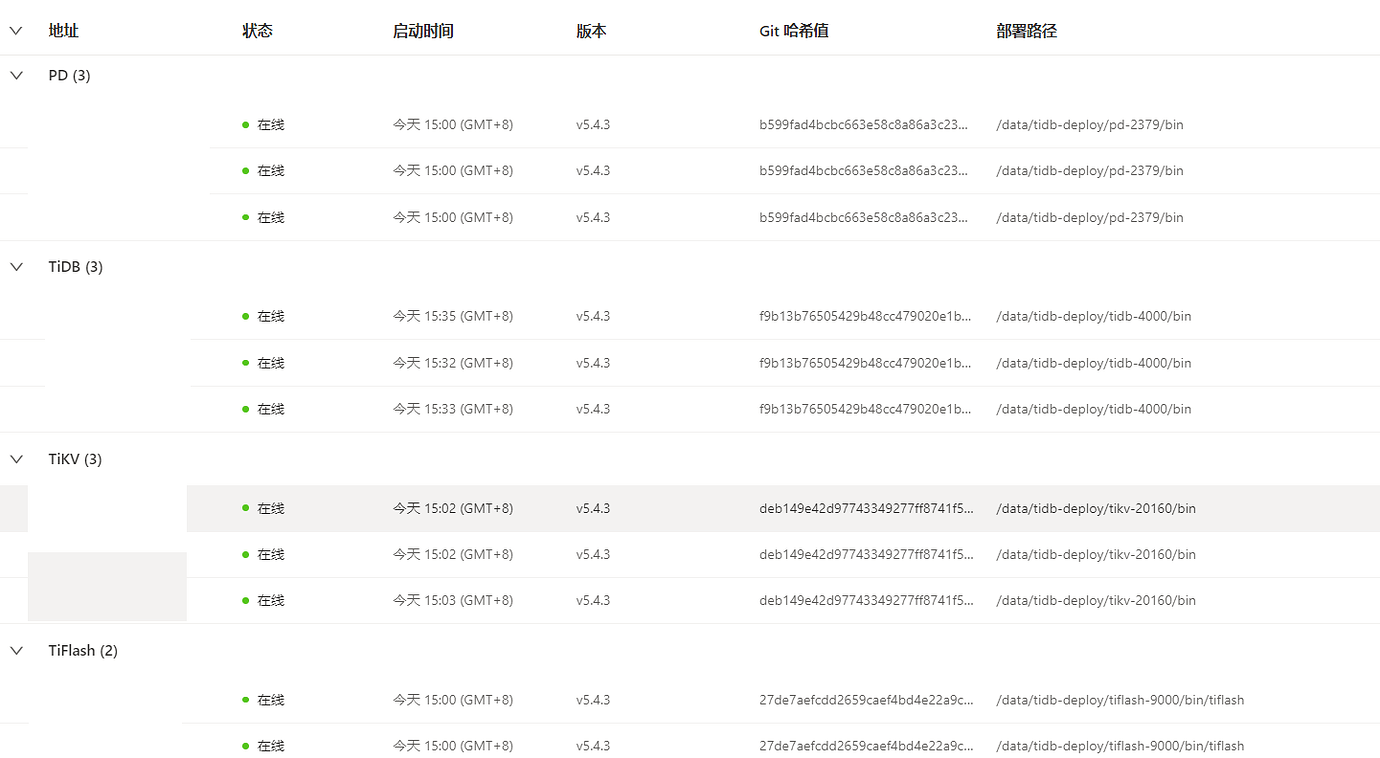
【TiDB Usage Environment】Production Environment
【TiDB Version】V5.4.3
【Reproduction Path】After setting gc_life_time from 10m to 48h, this phenomenon occurred two days later: the memory of the TiDB server computing node was exhausted in a very short time, causing repeated automatic restarts.
【Encountered Problem: Problem Phenomenon and Impact】
Problem Phenomenon: After restarting TiDB, when there is a high volume of user access, the system runs slowly.
Impact: The system cannot be used normally, queries are extremely slow, and query times are hundreds of times longer than before.
【Resource Configuration】
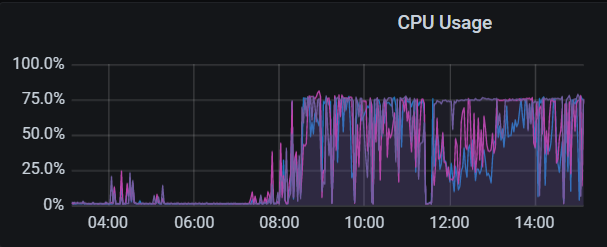
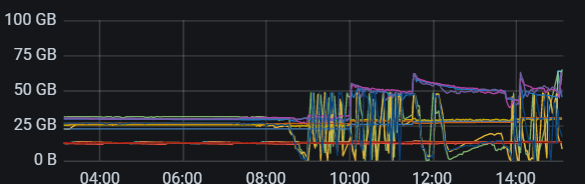
【Attachments: Screenshots/Logs/Monitoring】
Increasing the GC time, if the cluster deletes a lot of data, may cause a large accumulation of MVCC versions. You can check some large SQLs and look at the difference between process_key and total_key to confirm if this is the issue.
There is an obvious accumulation of slow queries. Optimize the SQL.
First, check the slow queries.
The GC setting is too large, isn’t it? If there is no GC for a long time, the queries will slow down.
If there are too many updates, setting the GC time too long is not suitable, as it will significantly slow down query execution speed.
So, may I ask if TiDB provides any mechanisms to solve the issue of queries becoming slower?
So, are there any solutions?
Hello, so how can this problem be solved? Do you know the solution to this problem?
Are there any immediate solutions? Optimizing SQL statements is a long-term solution.
Is there a solution for this slow query?
Since it is related to GC time, why don’t you try adjusting it back?
We have adjusted it, but the problem still exists. We also operated the GC throttling, but there was no improvement.
GC being only 48 hours is not the main reason. My cluster is set to 72 hours without any issues. You should focus on optimizing your SQL instead.
- Setting the GC to 48 hours caused the memory to rise quickly and frequent restarts. After adjusting it back, will the cluster return to normal and stop restarting?
- After restarting the cluster, queries are exceptionally slow when the traffic is high. Have you compared the request volume, business version, and monitoring metrics before and after the restart?
To pinpoint the issue, you still need to look at the monitoring, especially those related to TiKV, such as region and Coprocessor. If you want to rule out GC, you can check the GC-related metrics, such as GC tasks duration.
Bring in your business development team and the DBA, and optimize it together.
For your issue, see if you can reduce the GC time, for example, restore it to the default 10 minutes. Observe if the cluster’s performance improves.
Then, analyze slow queries, starting with troubleshooting and handling from the dashboard.
Directly go to the slowest SQL section and check if the delete_skipped_count is high. If it is, it means a lot of data has been deleted, and the GC not cleaning up could be causing a large amount of data to be scanned.
Increase the frequency of GC.
Try restoring the GC configuration.