Tidb server memory continues to grow - memory leak

Note:
This topic has been translated from a Chinese forum by GPT and might contain errors.

Original topic: Tidb server服务器内存持续增长 内存泄漏

| username: Inkjade

To improve efficiency, please provide the following information. A clear problem description can help resolve the issue faster:

[TiDB Usage Environment]
Production Environment

[Overview] Scenario + Problem Overview
The memory of the TiDB server continues to grow, causing OOM kills.

[Background] Actions Taken
Manually analyzed the memory of the TiDB server.
First analysis date: 2022/10/24

First analysis:
Second analysis:

TiDB server parameter configuration:
memory-usage-alarm-ratio=0.8
mem-quota-query=4294967296 (4G)
oom-action=cancel

Manual analysis original file:
[profiling_2022-10-24_15-13-42.zip|attachment] (6.8 MB)

Second original analysis file:
[profiling_2022-10-25_16-58-59.zip|attachment] (6.9 MB)

[Phenomenon] Business and Database Phenomenon
Database anomaly, direct restart

Recent 7-day TiDB server memory usage

OOM kill

[Problem] Current Issue Encountered
TiDB server OOM kill causing system service anomalies and restarts.

[Business Impact]
Data statistics service data is unavailable.

[TiDB Version]
v5.4.0

[Application Software and Version]

[Attachments] Relevant Logs and Configuration Information
/data/tidb_db/tidb-log]#dmesg |egrep -i -r ‘killed’ /var/log
/var/log/messages-20221002: Oct 1 17:24:48 PD205 systemd: tidb-4000.service: main process exited, code=killed, status=9/KILL
/var/log/messages: Oct 25 15:03:04 PD205 systemd: tidb-4000.service: main process exited, code=killed, status=9/K

Captured memory stack
[profile.zip|attachment] (7.2 MB)
| username: OnTheRoad | Original post link

You can try the following solutions:

  1. Adjust the SQL to split a single large transaction into multiple smaller transactions.
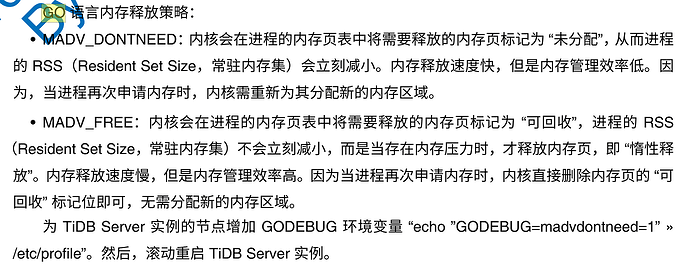
  2. Adjust the memory release strategy in Go language. As shown in the figure below.

| username: tidb狂热爱好者 | Original post link

Go check the slow SQL. Slow SQL caused OOM.

| username: Inkjade | Original post link

Okay. I’ll find some time to test the adjustment to see if it works. Thank you very much!

| username: 人如其名 | Original post link

Post the analyze version.
Also, check for any currently running SQL statements. Look in information_schema.cluster_processlist to see if there are any ongoing statements, and if so, post them for review.

| username: Inkjade | Original post link

The tidb_analyze_version parameter has been modified. The table has been re-analyzed. So far, it seems to have no effect.

| username: 人如其名 | Original post link

What has been changed? What are the currently executing statements?

| username: 近墨者zyl | Original post link

There are OOM cases every day…

| username: buddyyuan | Original post link

It looks like a statistics issue. How are the parameters for statistics set?

| username: 人如其名 | Original post link

I suspect that there are too many partitions in his partitioned table, and he hasn’t collected statistics, resulting in a temporary pseudo table. The related insert select operation is taking too long…

| username: alfred | Original post link

It looks like a steady increase, possibly due to some processes continuously increasing without proper release or a bug in TiDB itself. Are there any other programs running? Analyze it at the OS level.

| username: Inkjade | Original post link

Are you referring to the tidb_analyze_version analysis parameter? I’ve tried setting both tidb_analyze_version=1 and tidb_analyze_version=2, but it doesn’t seem to have much effect.

| username: jansu-dev | Original post link

Agree with this viewpoint +1;

  1. Memory usage and profile memory consumption do not match.
  2. Looking at go-threshold, it holds 25GB of memory, and reserved-by-go also holds 12GB of memory. This 12GB is held by the Go language itself. In v5, TiDB defaults to an aggressive memory release strategy, and there’s not much to adjust here. If you want to adjust this, you can try v6.3.0, which is built with Go 1.9 and will release memory more aggressively. Since this is a production environment, you can use GitHub - zyguan/mysql-replay: replay mysql traffics from tcpdump pcap file, like tcpcopy mysql-replay to collect production traffic, then continuously stress test the new version in a test environment. If the new version does not exhibit this issue, it proves that the problem is resolved in the new version.


MySQL Replay Traffic Playback Tool Description (2).pdf (308.3 KB)

| username: Inkjade | Original post link

I have already tried using the configuration parameter GODEBUG=madvdontneed=1 and tidb_analyze_version=1, then dropped the table analysis information and rebuilt it. Currently, I am observing the results. I will upgrade the version in the test environment later to verify if this issue exists in the new version!

Thank you very much!