Note:
This topic has been translated from a Chinese forum by GPT and might contain errors.
Original topic: TiDB tidb服务进程CPU使用率突然连续暴增
To improve efficiency, please provide the following information. A clear problem description can help resolve the issue faster:
[TiDB Related Information]
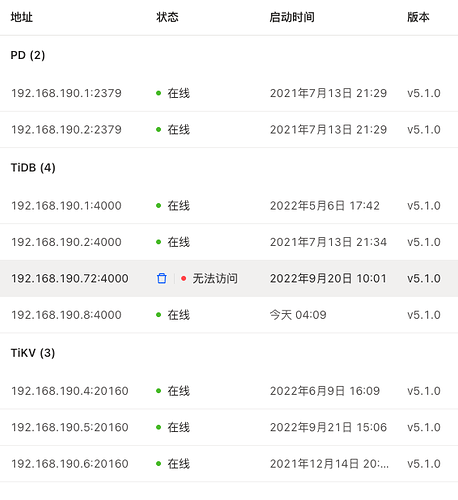
TiDB V5.1.0 with two PDs, two TiDBs, and three TiKVs

[Phenomenon Problem]
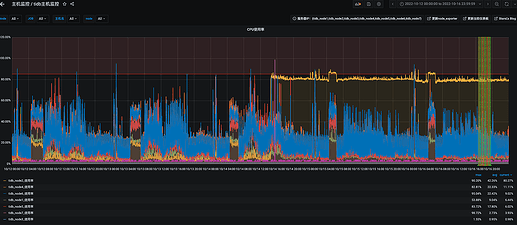
On October 14th at 2 PM, one of the TiDB nodes reported that the CPU exceeded the threshold and has remained high since then.
[Problem Alert Screenshot]
Node CPU Monitoring Chart
Node Top Real-time Chart
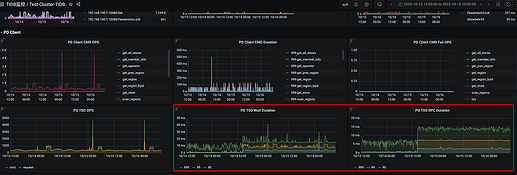
Grafana TiDB Monitoring Information Chart
[Problem Assistance]
How to troubleshoot the CPU surge? How to find the root cause of the CPU surge?
The sudden increase in TiDB’s CPU usage is generally caused by slow queries. You can check if there are any slow queries or locks on the current node.
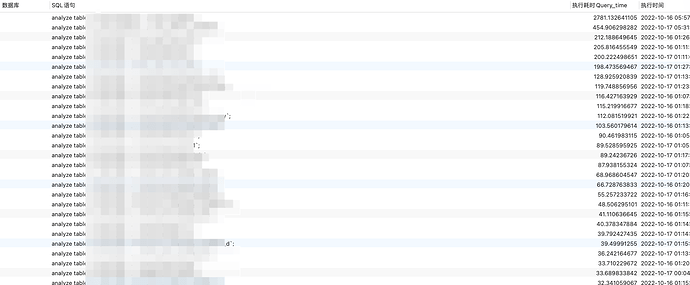
Additionally, you need to check if there are any scenarios where automatic analyze has failed and how it is configured.
This is the slow SQL query result.
SELECT
	DB AS 'Database',
	`Query` AS 'SQL Statement',
	Query_time AS 'Execution Time Query_time',
	Time AS 'Execution Time',
	`User` AS 'Execution User',
	`Host` AS 'Host',
	Total_keys AS 'Total Scanned Keys Total_keys',
	Index_names AS 'Involved Index Names'
FROM
	INFORMATION_SCHEMA.SLOW_QUERY
ORDER BY
	Query_time DESC
	LIMIT 100;
1:
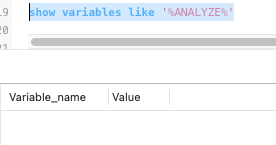
show variables like '%ANALYZE%' shows no related variables and configurations.

2:
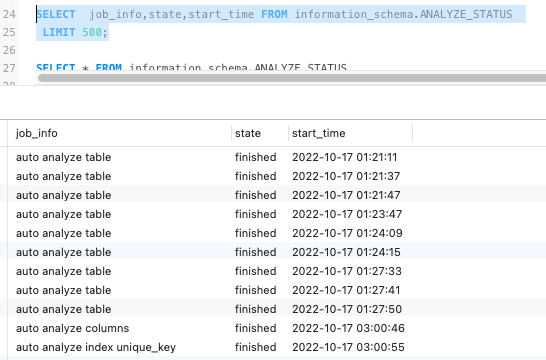
SELECT job_info, state, start_time FROM information_schema.ANALYZE_STATUS LIMIT 500; query results, all jobs are finished.

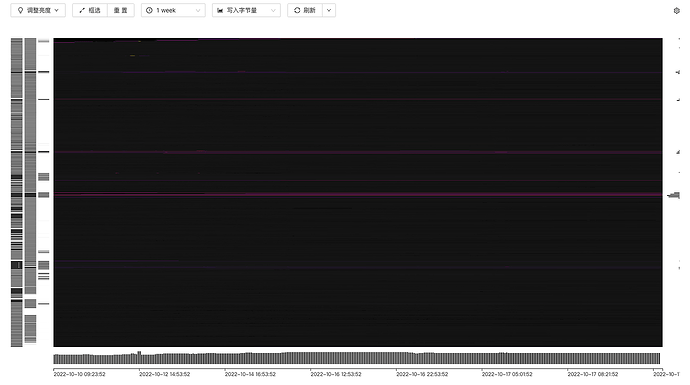
3: Heatmap
Here are two suggestions you can try adjusting:
-
Change tidb_analyze_version to 1. This is because version 2 is an experimental feature in version 5.1 and has some issues. I remember there were a few issues related to this.
-
Shorten the end_time and start_time. You can set it to one to two hours during off-peak business hours. Check the results after making the changes.
You’re welcome. Once it’s done, you can observe if there are any effects.
The essence is tidboom. The reason is data issues. The SQL is slow SQL.
@db_user @tidb Enthusiast
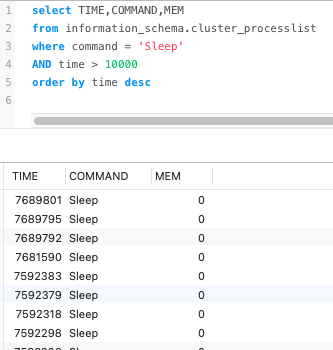
I found a lot of slow SQL queries. I want to manually kill these processes to see if the CPU usage can decrease, but I encountered another problem. Using kill tidb + process ID doesn’t work.  Related issue link: show processlist的进程号杀不掉,且sleep时间超过time_out的限制时间,为什么不断开 - #3,来自 Hi70KG - TiDB 的问答社区

If it happens on the corresponding instance (if you can’t kill it on TiDB using SQL), then it’s a bug. I resolved it by restarting the TiDB node.
To handle slow SQL, you need to optimize it by adding indexes or changing the logic and writing of the SQL. In short, try to minimize the amount of data returned from TiKV to the TiDB server, or implement flow control on the frontend.
OK, I’ll try restarting that node tonight.
As long as the data operation has a slightly higher computational complexity, developers who can solve it with SQL resolutely do not want to write code to solve it. They will only say, why is the database performance so poor 
Ask the leadership to communicate more with the developers. If operations and development are disconnected and each is busy with their own tasks, it will cause issues for both the application system and the database. Establish development standards, and ensure that development testing, stress testing, and DBA involvement are all part of the process.
Haha, everyone wants to take the easy way out.
This topic was automatically closed 60 days after the last reply. New replies are no longer allowed.
