Note:
This topic has been translated from a Chinese forum by GPT and might contain errors.
Original topic: tidb 写入慢延迟高
[Overview] Scenario + Problem Overview
When TiDB is performing concurrent writes,
insert statements are almost all completed within 8-10 seconds
with around 100 concurrent business inserts.
[Problem] Current Issue
Insert writes are very time-consuming.
The SQL statement is as follows, with 300 rows of data concatenated in each batch:
INSERT INTO
    `xxxx_ods_latest` (
    `marketplace_id`,
    `asin`,
    `item_md5`,
    `res_json`,
    `request_timestamp`
  )
VALUES
  (...),
  (...),
  (...),
  (...) ON DUPLICATE KEY
UPDATE
  `item_md5` = IF (
    `xxxx_ods_latest`.`item_md5` !=
    VALUES
      (`item_md5`),
    VALUES
      (`item_md5`),
      `xxxx_ods_latest`.`item_md5`
  ),
  `res_json` =
VALUES
  (`res_json`),
  `request_timestamp` =
VALUES
  (`request_timestamp`);
[Business Impact]
Kafka cannot consume all messages, resulting in data delays.
[TiDB Version]
V5.4.0
[Attachments] Relevant logs and monitoring (https://metricstool.pingcap.com/)
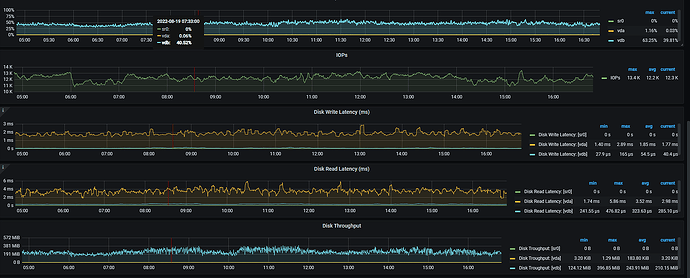
It looks like network latency. Check the node_exporter and black_exporter monitoring. Also, check the disk IO situation.
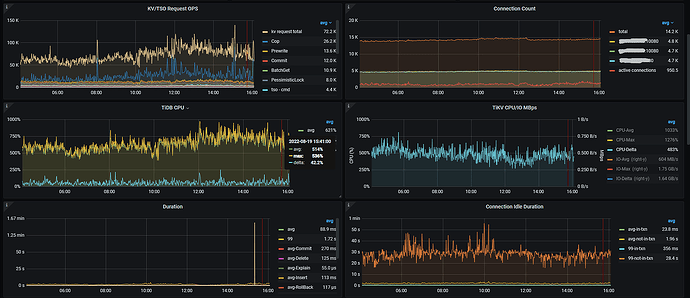
Follow this link https://metricstool.pingcap.com/#backup-with-dev-tools to export the overview, TiDB, TiKV detail, and PD monitoring periods. Make sure to wait until all panels are fully expanded before exporting.
Here are the logs
tidb_log_json.zip (2.6 MB)
The error message indicates that the system is unable to find the libtinfo.so.5 library. This is because the library is not installed on your system. You can try installing it using the following command:
sudo apt-get install libtinfo5
After installing the library, try running your program again.
The image you provided is not accessible. Please provide the text you need translated.
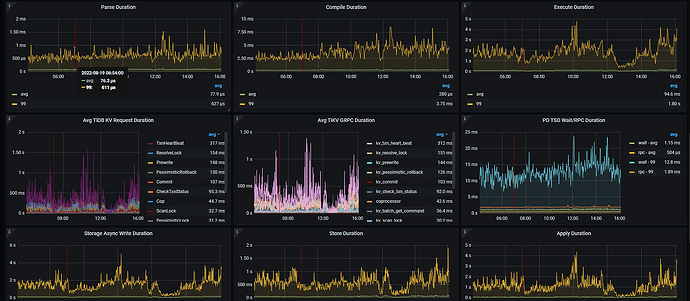
According to the approach in the above two images, check which part has slowed down.
Is there a specific optimization plan?
First, identify which part is slow, then determine how to optimize it.
Some panels in the export have no data, and many regions have been added to some TiKV nodes, resulting in high CPU utilization. What are the values of the parameters split.qps-threshold and split.byte-threshold? Is the disk space of each TiKV the same, and have region_weight and leader weight been set?
split.qps-threshold = 3000
split.byte-threshold = 31457280
No region_weight or leader weight set.
Is the write performance normal now? What is the current status of the two previous monitoring screenshots?
The metrics have declined. Yesterday, we increased the scheduler-worker-pool-size and storage.block-cache.capacity.
Awesome, I will learn from you.
Check the settings for raftstore.store-pool-size and raftstore.apply-pool-size. These should be as consistent as possible. The former represents the producer’s capacity, while the latter represents the consumer’s capacity. If the former value is much larger than the latter, it can affect the write speed.
The values of these two parameters are both 2.
If your machine resources are relatively high, you can appropriately increase these two parameters to enhance production and consumption capabilities.
The high tail latency of writes is mainly due to the raftstore thread propose/apply wait. You can follow the suggestion above and first increase the size of these two thread pools based on the current CPU and IO resource situation.


