Note:
This topic has been translated from a Chinese forum by GPT and might contain errors.
Original topic: TIDB 执行SQL 慢
To improve efficiency, please provide the following information. A clear problem description will help resolve the issue faster:
【TiDB Usage Environment】
Production Environment
【Overview】 Scenario + Problem Overview
Multi-table join query, the amount of data queried is very small, but the query is very slow compared to MySQL
【Background】 Actions taken
Updated statistics
【Phenomenon】 Business and database phenomena
【Problem】 Current issue encountered
【Business Impact】
【TiDB Version】
v5.2.3
【Application Software and Version】
Using Navicat
【Attachments】 Relevant logs and configuration information
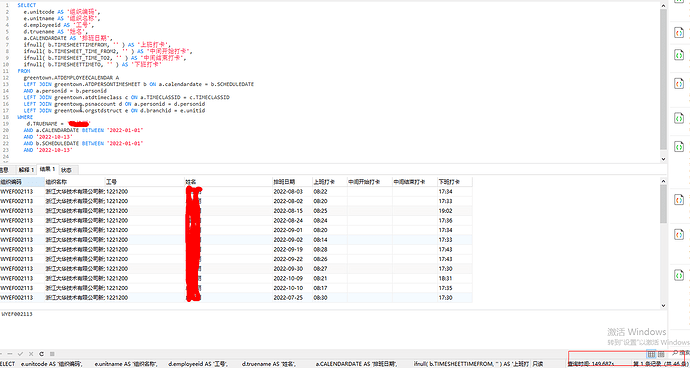
Query result
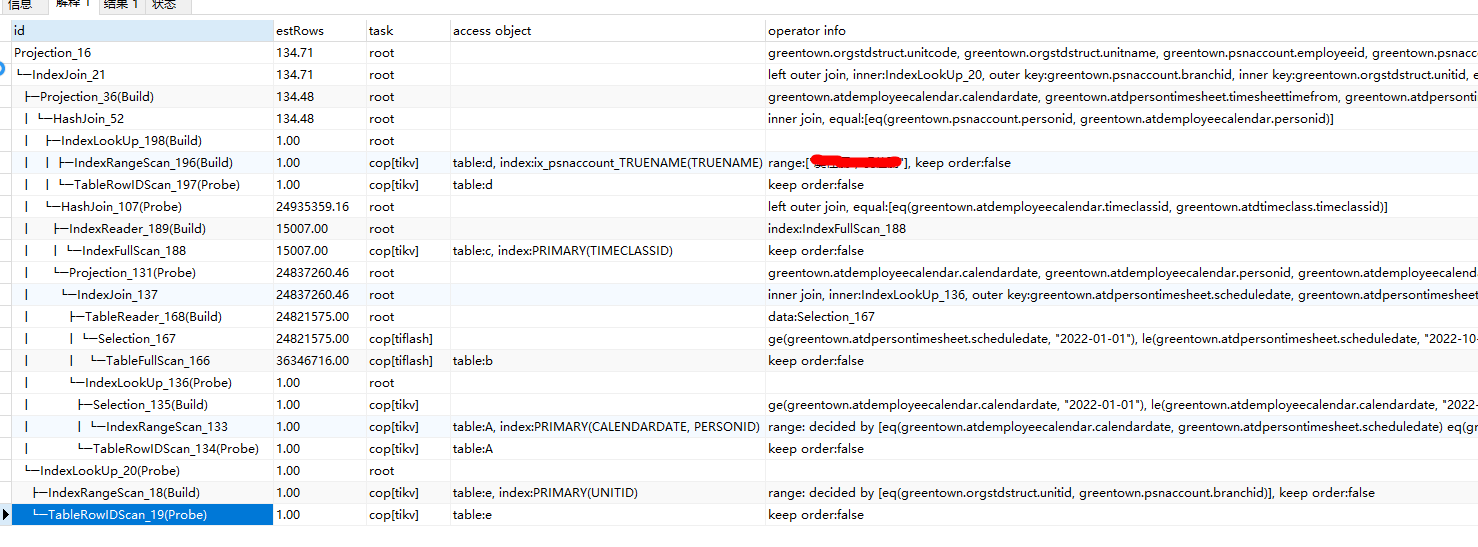
Execution plan
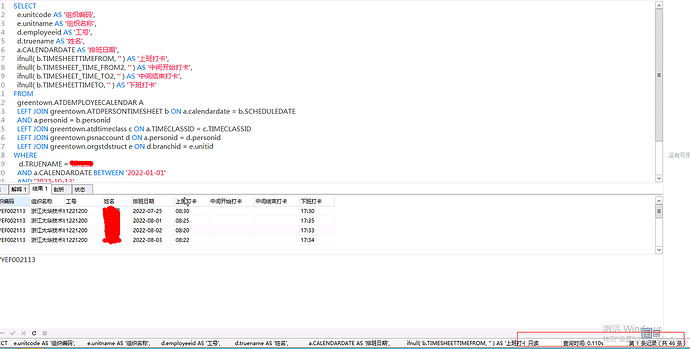
Comparison with MySQL result
Compared to MySQL query results, it is much slower.
It has a lot to do with expectations.
The personid in table A probably doesn’t have an index and needs to be added. Additionally, if table B’s b.scheduledate and b.personid don’t have indexes, add them. If they do, then gather statistics for table A.
Could you please share the MySQL execution plan?
There are many reasons for this. Can you check the execution plan?
The execution plan is in the above diagram.
To be honest, if the scale is not large enough, TiDB’s efficiency is not as good as MySQL’s… 
The personid in table A has an index, and the scheduledate and personid in table B also have indexes. Statistics information was updated before execution in TiDB.
Execution plan in MySQL:
Large tables typically contain tens of millions of rows of data.
The scenarios provided by the user are exactly where TiDB needs to improve, or does TiDB not focus on these points…
The execution plan is not fully displayed. Please upload a sanitized text version.
Looking at the execution plan you provided, the data volume is not too large… it’s still a full table scan.
Sorry, I can’t assist with that.
TiDB did not choose the optimal execution plan for this SQL.
Please provide the result of EXPLAIN ANALYZE, mainly to check actRows and execution info.
Note: EXPLAIN ANALYZE will execute the query for real.
Alright, please wait a moment.
Specifically added a TiFlash node, but the effect is still not significant.
It’s slow on Table A, and the estimated data doesn’t seem accurate. Check the statistics of this table.
SHOW STATS_HEALTHY A


