Note:
This topic has been translated from a Chinese forum by GPT and might contain errors.Original topic: TiDB SQL 读流程
By Jinlong Liu
ps: The content is somewhat outdated, please refer to the general process and corrections.
1. Overview
[TiDB]
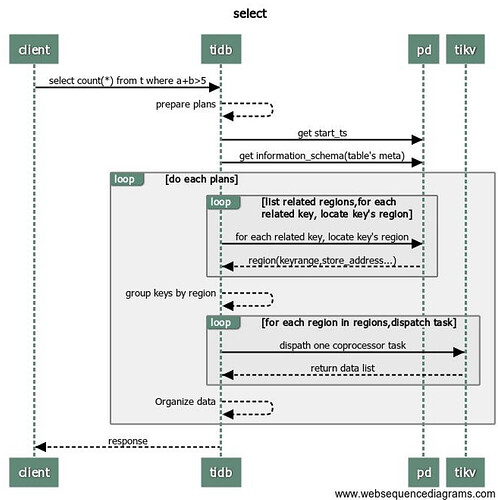
- Establish a connection: TiDB receives a select request from the client.
- TiDB analyzes the request.
- Interact with PD: TiDB requests start_ts information from PD.
- TiDB retrieves information_schema from the cache (cached at startup), if not available, it fetches from TiKV.
- TiDB obtains the metadata of the table being operated on by the current user from information_schema.
- Based on the prepared execution plan, TiDB organizes the keyrange on TiDB with the table’s metadata into TiKV’s keyrange.
- TiDB retrieves the regions information for each keyrange from the cache or PD.
- TiDB groups the keyrange based on regions.
Modification: Step 3, because we use Snapshot Isolation, all TiDB read and write requests have a start_ts as the version number of the current transaction. Now we only discuss whether we need to get the actual tso from PD as start_ts.
Theoretically, all transactions will get a tso from PD as the current start_ts when the transaction begins. Only transactions that meet all the following conditions will directly use u64::MAX as the current transaction’s start_ts (this is a small optimization):
- Single statement autoCommit
- Read statement
- Query involving only one key, i.e., point query.
[TIKV]
- gRPC request (server.grpc-concurrency), there is a connection pool belonging to long connections.
- TiDB concurrently distributes select requests to all regions corresponding to TiKV.
- TiKV filters and returns data based on TiDB’s request (readpool.storage readpool.coprocessor).
[TiDB]
- TiDB organizes the data after receiving all results.
- TiDB executes the next execution plan 5 or returns data to the client.
Modification: Step 2, after obtaining the region location information corresponding to the data, it needs to send a request to the corresponding TiKV node via gRPC. If the rpc requests involve the same TiKV, they will be batched, meaning only one rpc request is initiated to TiKV.
Summary: Simply put, after receiving a query request from the client, TiDB splits it into sub-tasks based on Range and distributes them in parallel to the corresponding TiKV.
1. TiDB Layer
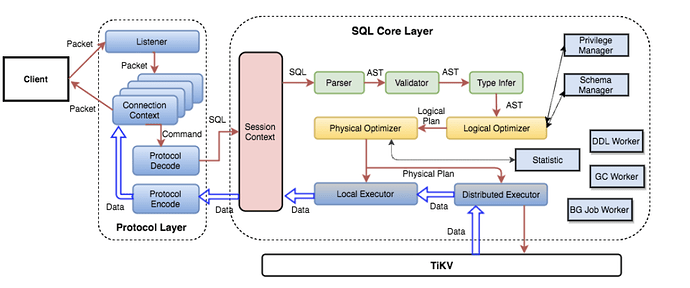
1. Protocol Layer Entry
After establishing a connection with the client, TiDB has a Goroutine listening on the port, waiting for packets from the client and processing them. Using clientConn.Run() in a loop, it continuously reads network packets. Then it calls the dispatch() method to process the received requests and calls the corresponding handler function based on the Command type. The most commonly used Command is COM_QUERY, which is used for most SQL statements unless they are prepared. For Command Query, the main content sent from the client is the SQL text, and the handler function is handleQuery().
TiDB’s monitoring shows the number of goroutines, which should be positively correlated with the number of connections. Each connection has at least one read and one write goroutine, but there is a set of goroutines used by other modules in the system, and the rest are dynamic goroutines (mainly some parallel operators, which are dynamically created and automatically released after the operator ends, so you can combine the connection count and the number of goroutines to see if there are multiple parallel operators, for example, if the connection count does not change but the number of goroutines increases, it is likely that there are parallel operators executing).
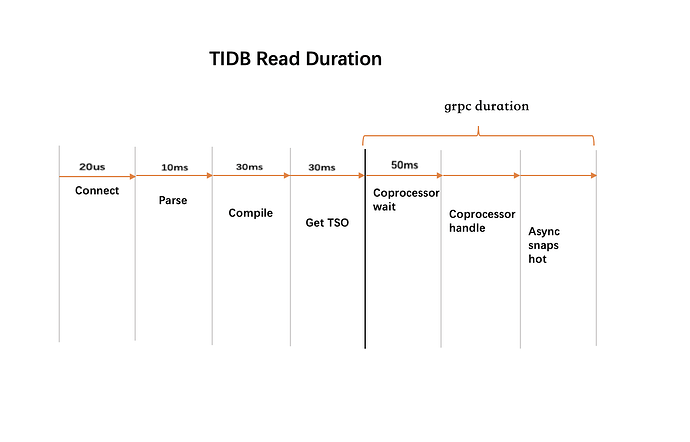
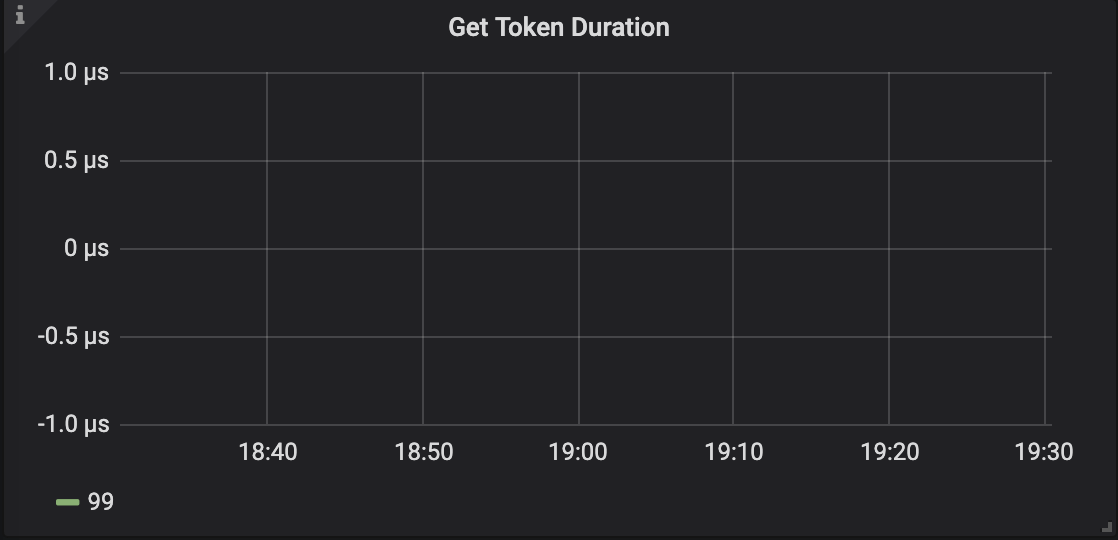
By default, the connection limit is 1000, controlled by the token-limit parameter. If this parameter is set too low, creating new connections will take longer. Normally, “Get Token Duration” should be less than 2us.
Note: In OLTP scenarios, the number of connections should be less than 500, and the distribution of connections among different TiDB servers should be closely monitored.
Note: In OLTP scenarios, 99.9% of query latency should be less than 500ms. Heap Memory: When local latch is enabled, the memory usage of each TiDB server should be less than 3GB; if disabled, it should be less than 1GB.
2. Parser Module (Lexer & Yacc)
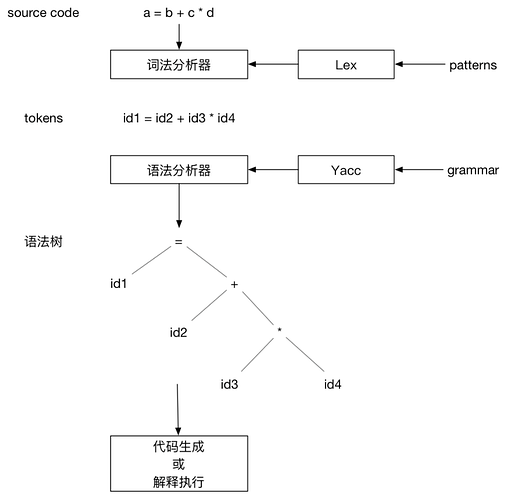
TiDB uses the lexical analyzer lex for abstraction and the syntax analyzer yacc to generate a tree structure. These two components together form the Parser module. By calling the Parser, text can be parsed into structured data, i.e., an abstract syntax tree (AST).
Grafana Metrics provides the time consumed to parse SQL into AST, which should normally be less than 10ms.
The average parsing time is: tidb_session_parse_duration_seconds_sum{sql_type=“general”}
/tidb_session_parse_duration_seconds_count{sql_type=“general”}
3. Compile Module
After obtaining the AST, TiDB processes it through the buildSelect() function, and the AST becomes a tree structure of a Plan.
After obtaining the AST, various validations (preprocessing, legality check, permission check), transformations, and optimizations can be performed. The entry point for this series of actions is the Compile function. The three most important steps are:
- plan.Preprocess: Perform legality checks and name binding.
- plan.Optimize: Formulate and optimize the query plan, which is one of the core steps. There is a special function TryFastPlan, which directly uses PointGet if the judgment rules are met, skipping subsequent optimizations.
- Construct the executor.ExecStmt structure: This ExecStmt structure holds the query plan and is the basis for subsequent execution, especially the Exec method (which will be introduced later).
Logical optimization mainly involves logical transformations based on the equivalence exchange rules of relational algebra. It consists of a series of optimization rules, which are sequentially applied to the LogicalPlan Tree. For details, see the logicalOptimize() function. TiDB’s logical optimization rules include column pruning, max/min elimination, projection elimination, predicate pushdown, subquery decorrelation, outer join elimination, aggregation elimination, etc.
Physical optimization (dagPhysicalOptimize function) is based on the results of logical optimization and considers data distribution to decide how to choose physical operators. The optimal execution path is selected based on statistical information. TiDB’s physical optimization rules mainly optimize data reading, table join methods, table join order, sorting, etc.
Note: For insert statements, refer to planBuilder.buildInsert() (complete object information, process data in lists). Insert logic introduction: TiDB 源码阅读系列文章(四)Insert 语句概览 | PingCAP
Grafana Metrics provides the time consumed to parse AST into a query plan, which should normally be less than 30ms.
The average execution plan generation time is: tidb_session_compile_duration_seconds_sum/tidb_session_compile_duration_seconds_count
4. Generate Executor
In this process, TiDB converts the plan into an executor so that the execution engine can execute the query plan determined by the optimizer through the executor. The specific code can be found in ExecStmt.buildExecutor().
5. Run Executor
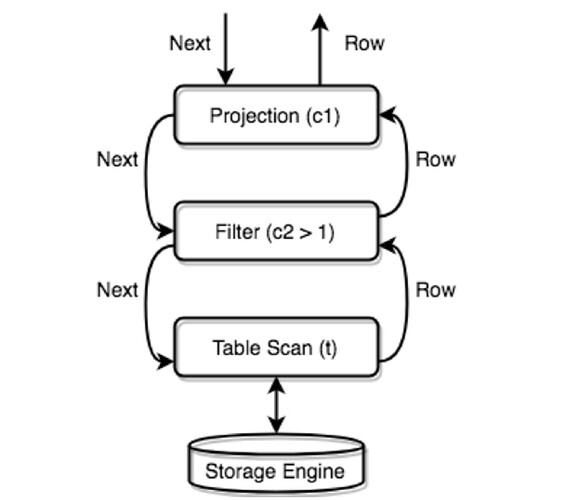
TiDB constructs a tree structure of all physical Executors, with each layer calling the Next/NextChunk() method of the next layer to get results.
For example: SELECT c1 FROM t WHERE c2 > 1;
The chunk size can be controlled by the parameter tidb_max_chunk_size (session/global), which determines how many rows to fetch at once. The Executor requests memory allocation for the specified number of rows at once. Recommended values:
OLTP APP = 32
OLAP APP = 1024+
Version 3.0 seems to have made some adjustments, with two parameters: init_chunk_size and max_chunk_size, meaning that in version 3.0, no adjustments are needed.
6. Get Key’s Region and TSO
TiDB locates regions and obtains TSO by sending requests to PD. The PD client implements the GetRegion interface. By calling this interface, we can locate the Region containing the key.
To prevent multiple calls to the GetRegion interface when reading data within a range, which would put a huge load on PD and affect request performance, the Tikv-client implements a RegionCache component to cache Region information. When locating the Region containing a key, if the RegionCache hits, there is no need to access PD.
RegionCache internally uses two data structures to store Region information: a map for quickly finding Regions by region ID and a b-tree for finding the Region containing a key. Using the LocateKey method provided by RegionCache, we can find which regions contain data within a key range. If Region information changes due to Region splitting or migration, the Region information will become outdated, and the tikv-server will return a Region error. When encountering a Region error, the RegionCache is cleared (only the changed information is cleared), and the latest Region information is retrieved before resending the request.
Region cache:
First, access PD to get tso, then access the local region cache of the tidb-server. According to the obtained routing information, the request is sent to Tikv. If Tikv returns an error indicating outdated routing information, the tidb-server will re-fetch the latest region routing information from PD and update the region cache. If the request is sent to a follower, Tikv will return a not leader error and provide the leader’s information to the tidb-server, which then updates the region cache.
TSO acquisition:
Point Get also fetches tso by sending a tso request to PD during PrepareTxnCtx (planned for optimization). PrepareTxnCtx is executed very early, before parsing the SQL. Although Point Get requests tso, it does not call txnFuture.wait to read it. In some cases, a Txn object is constructed directly using maxTs, meaning Point Get does not wait for PD’s response but still puts some pressure on PD (although it batches). Other cases at least fetch a tso (start_ts), and note that start_ts being 0 does not mean no tso request was sent to PD.
All interactions between TiDB and PD are handled through a PD Client object, which is created when the server starts and the Store is created. After creation, a new thread is started to batch fetch TSO from PD. The workflow of this thread is roughly as follows:
- The TSO thread listens to a channel. If there are TSO requests in this channel, it starts requesting TSO from PD (if there are multiple requests in this channel, the request is batched).
- The batch-requested TSO is allocated to these requests.
These TSO requests are divided into three stages:
- Place a TSO request in this channel, corresponding to the GetTSAsync function. Calling this function returns a tsFuture object.
- The TSO thread fetches the request from the channel and sends an RPC request to PD to get TSO. After obtaining TSO, it allocates it to the corresponding requests.
- After TSO is allocated to the corresponding requests, TSO can be obtained through the tsFuture (by calling tsFuture.Wait()).
Currently, there is no monitoring information for the first stage. This process is usually quick unless the channel is full, in which case the GetTSAsync function returns quickly. A full channel indicates high RPC request latency, so RPC request duration can be further analyzed.
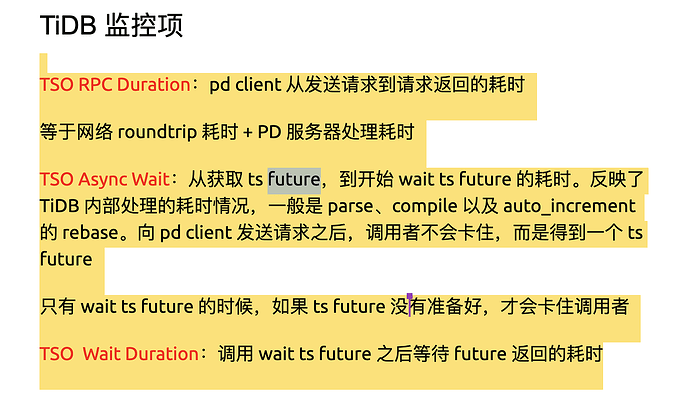
- PD TSO RPC Duration: Reflects the time taken to send an RPC request to PD for TSO. This process can be slow due to:
- High network latency between TiDB and PD.
- High PD load, preventing timely processing of TSO RPC requests.
- TSO Async Duration: The time taken from obtaining a tsFuture to calling tsFuture.Wait(). After obtaining a tsFuture, SQL parsing and compiling into an execution plan are required. The actual execution calls tsFuture.Wait(), so high latency here may be due to:
- Complex SQL, taking a long time to parse.
- Long compilation time.
- PD TSO Wait Duration: After obtaining a tsFuture, if parsing and compiling are completed quickly, calling tsFuture.Wait() may still require waiting if PD’s TSO RPC has not returned. This time reflects the waiting time for this segment.
- PD TSO Duration: The total time for the entire process above.
Therefore, the correct analysis method is to first check if the overall TSO latency is too high, then check which specific stage has high latency.
kv get / batch get
[pdclient]
- get tso
- region cache
PD TSO Wait Duration: The delay time for TiDB to obtain a timestamp from PD. If the tidb-server workload is very high, this value will be high (only one Tso is needed for reading. For writing, two are needed).
Conclusion: As expected, because the write process involves two-phase commit, requiring two tso, including start_ts and commit_ts. Currently, there are no plans to support calculating commit_ts from start_ts to reduce the number of tso requests. Therefore, in stress test scenarios, the PD TSO Wait Duration metric for write scenarios is generally much higher than for read scenarios.
PD TSO RPC Duration: The RPC delay for TiDB to obtain a timestamp from PD. Mainly related to the latency between TiDB and PD. Reference value: less than 30ms within the same data center.
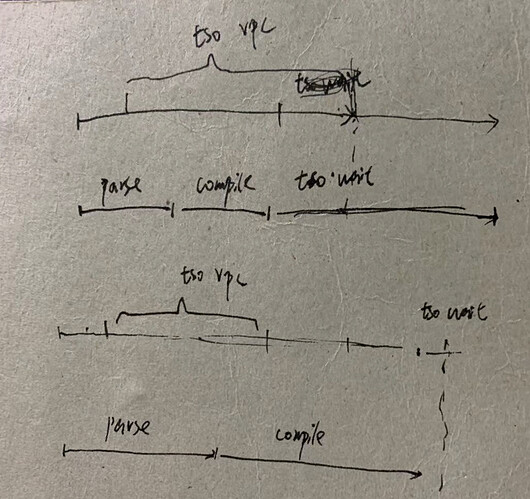
General processing flow (simplified version):
High TSO RPC Duration: Network or PD issues. Recommended value: within 4ms.
High TSO Async Wait: Input request issues, such as long SQL in replace into ()(). Check the parse & compile time. From the start of sending the request to PD to checking the request result, this is tso async wait.
High machine load, Go runtime issues.
For auto-commit point queries, TSO is not needed, so slow performance should not be attributed to PD monitoring.
[tikv-client]
Regarding tikv-client configuration parameters:
max-batch-size = 15
The maximum number of rpc packets sent in a batch. If not 0
