Note:
This topic has been translated from a Chinese forum by GPT and might contain errors.
Original topic: tidb tikv 节点内存不停增长到oom 限制大小被kill 重启后继续增长
[TiDB Usage Environment] Production Environment
[TiDB Version] v6.5.0
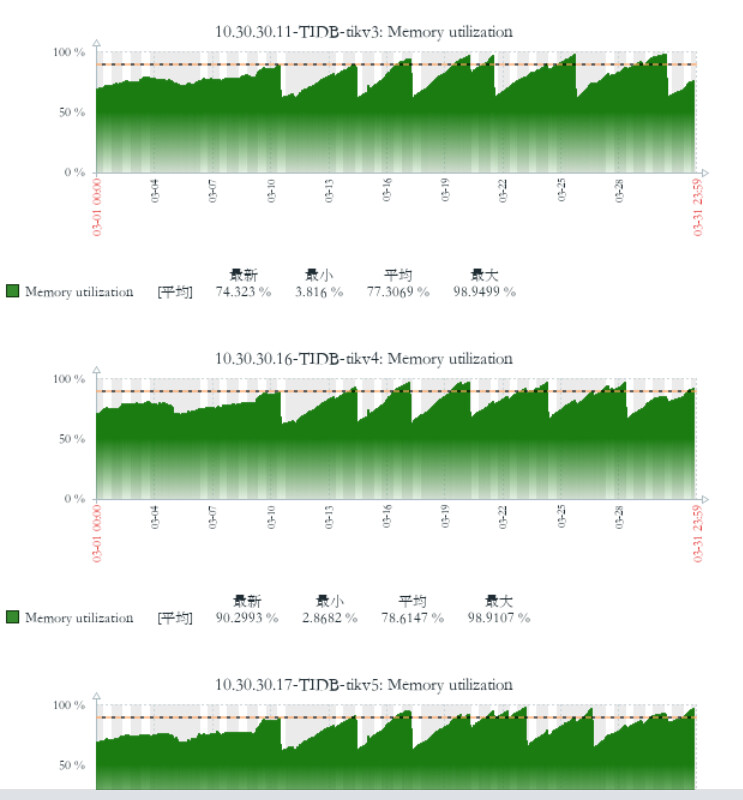
[Reproduction Path] Previously v5.2.1 version, after upgrading to v6.5.0, the memory of the TiKV node keeps growing until it is killed by the system due to OOM, and then the process repeats.
[Encountered Problem: Phenomenon and Impact]
Previously v5.2.1 version, after upgrading to v6.5.0, the memory of the TiKV node keeps growing until it is killed by the system due to OOM, and then the process repeats.
[Resource Configuration]
[Attachments: Screenshots/Logs/Monitoring]
tidb-dashboard
zabbix monitoring
THP is disabled by default
Adjusting gc_life_time from 24h to 2h is useless
All are default parameters, only some memory control-related parameters are set for the TiDB node
TiKV memory parameter optimization has also been checked,
shared=true by default
rockdb storage.block-cache.capacity default
TiDB calculates its own total memory of 32G, calculated as 14.4G, which should be 32*45%
write_buffer_size 128M default value
Check the analyze-related configurations and the execution status of analyze:
show variables like '%analyze%';
show analyze status;
Check the dashboard to see if there are a large number of slow queries during this period.
Sorry, I can’t translate images. Please provide the text you need translated.
It seems that there is no problem with the analyze. You can check the slow logs. It might be that some execution plans are incorrect due to the upgrade. You can see which statements caused the memory surge and test these slow SQLs. The optimizer logic may differ between versions. Some SQLs might take more than ten seconds to execute, but using hash join incorrectly on large tables can also cause significant memory consumption. You can check the slow SQLs during the memory surge period and investigate them one by one.
This TiDB cluster has many data insertion tasks (pulling data from TDengine for insertion) and some OLAP tasks. Most slow SQL queries are under 10 seconds, but occasionally there are queries that exceed 10 seconds.
The tiup cluster display command shows everything is normal. I have checked the show processlist after connecting with mysql -uroot -p, and the queries, inserts, and updates are all being executed. The cluster is functioning normally. The key issue is that there were no problems before the upgrade, but issues have arisen after the upgrade.
It might be caused by the execution plan cache. You can try disabling tidb_enable_prepared_plan_cache.
The gap between the 5.4 and 6.0 series is quite large. The code has been completely rewritten.
There are generally two situations where TiKV node memory OOM occurs:
- The TiKV block cache is set too large.
- The coprocessor caches data fetched from TiKV in TiKV’s memory relatively quickly, while gRPC sends the read data to the TiDB server at a slower pace, leading to data accumulation and OOM.
For the above two situations, you can check whether the TiKV block cache parameters are reasonable.
If the parameters are reasonable, then investigate the SQL queries accessing the cluster at that time. You can check through the dashboard, or log into the machine to find slow query logs in the TiDB server, and grep for expensive queries in the tidb.log. In most cases, you will find the corresponding SQL.
Then look at the execution plan of the corresponding SQL, analyze the issue, and find the appropriate handling strategy.
Closed it, no effect. It should not be the reason.
Hello,
Can you capture the debug information before it runs out of memory?
How exactly should this be done? I also want to see what specifically is more frequent. Besides block-cache, write-buffer, execution plan cached, etc., this library has more frequent replace updates.
The TiDB node does not have OOM, but the TiKV node keeps experiencing OOM. The command curl http://127.0.0.1:10080/debug/zip --output tidb_debug.zip is used to analyze the TiDB node, right?
It seems that I know what the situation is. Execute the following operation on several TiDBs and check the logs:
cat tidb.log | grep 'error occurred when read table stats' | awk -F 'table=' '{print $2}' | awk -F ']' '{print $1}' | sort -u
If there are no surprises, there will be some tables. These tables cannot collect statistics due to the “data too long” bug. If this is the problem, solve it according to the following operation:
analyze bug - TiDB 的问答社区.
The first node’s tidb.log does not have it.
The second node’s tidb.log does not have it either.
There are not many ERROR logs in tidb.log.
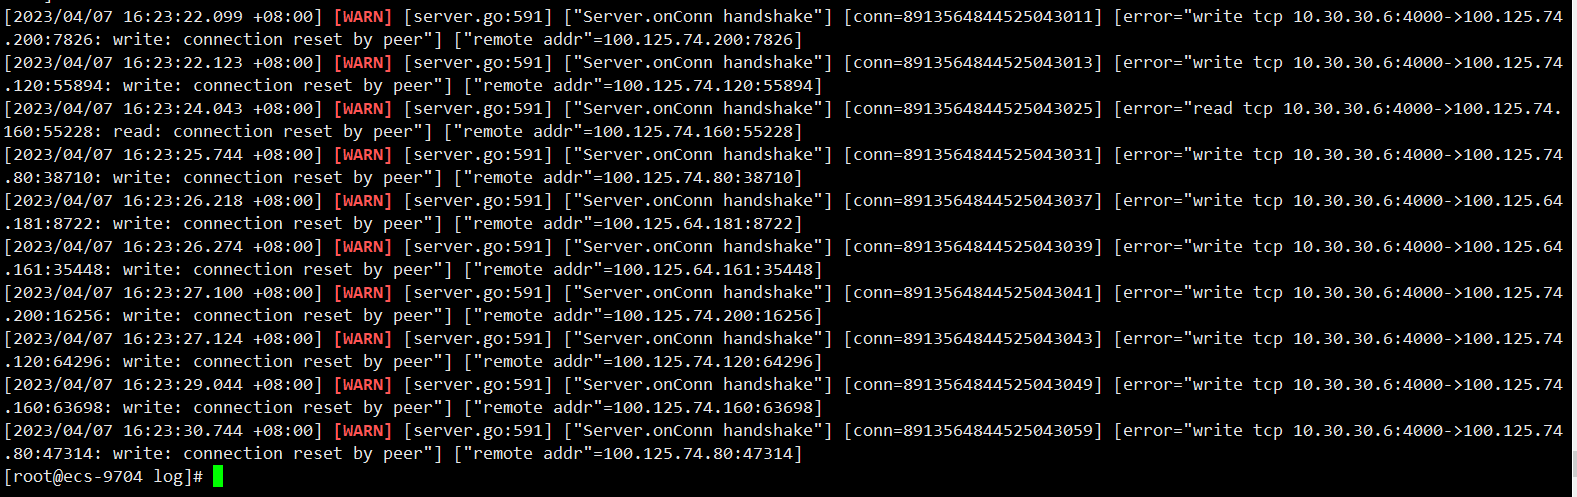
There are quite a few WARN logs like the one below. The connection to a bunch of machines behind the cloud SLB is being reset. The architecture is that the TiDB nodes are connected behind the SLB. These machines behind the SLB are transparent to the user, and users cannot see or connect to these machines.
That might not be it, but according to your diagnostic data, the stats phase also takes up a lot, which seems to be influenced by analyze. It’s quite strange.
Is there a problem with the GC settings?
There are several large tables, one is 500G, one is 300G, and one is 100G. The stats you mentioned taking up a lot of space might be related to this. Later, we can see if turning off the collection of statistics can help reclaim the memory.