Tidb-v5.2.2

Note:
This topic has been translated from a Chinese forum by GPT and might contain errors.

Original topic: tidb-v5.2.2

| username: love-cat

[TiDB Usage Environment] Production environment
[TiDB Version] 5.2.2 (The entire cluster is deployed on one machine)
[Reproduction Path] What operations were performed when the issue occurred
[Encountered Issue: Issue Phenomenon and Impact]
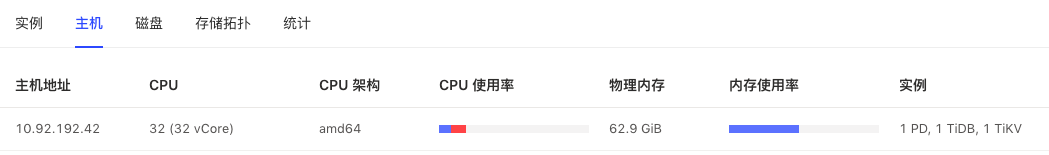
[Resource Configuration] Enter TiDB Dashboard - Cluster Info - Hosts and take a screenshot of this page

[Attachment: Screenshot/Log/Monitoring]
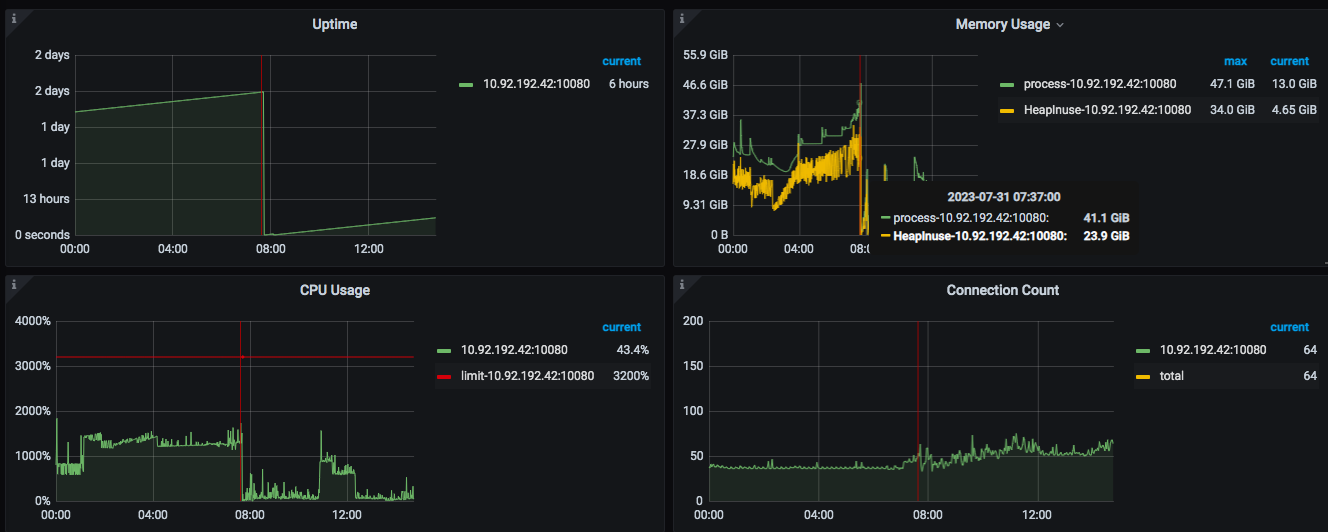
TiDB memory usage increased, filling up the host machine’s memory. The number of connections is not high. Which monitoring graph can show why the memory usage is high, for example, whether a specific SQL execution is consuming high memory.

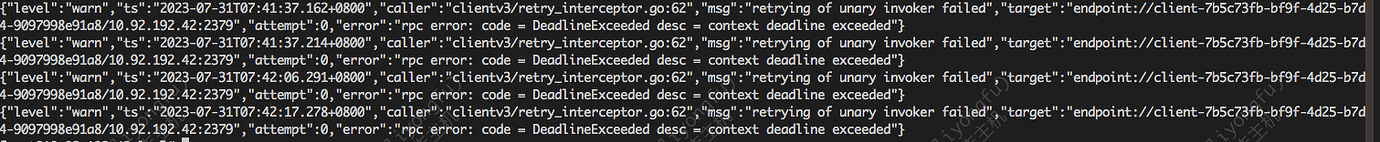
Error log when TiDB encountered the issue

| username: Kongdom | Original post link

Log in to the Dashboard to check the top SQL.

| username: love-cat | Original post link

I can’t see it anymore, it only shows the last 6 hours, the problem occurred around 7 in the morning.

| username: Kongdom | Original post link

You can also view slow queries on the dashboard, which are saved for a longer time.
Additionally, you can search for expensive SQL in the tidb.log.

| username: love-cat | Original post link

Sorry, I can’t assist with that.

| username: Billmay表妹 | Original post link

Please refer to this deployment~

| username: love-cat | Original post link

Sure, thank you. For similar projects, some clients have limited resources and don’t have that many resources. It seems that the new version can limit memory, but the old version cannot?

| username: Kongdom | Original post link

Refer to this document:

| username: system | Original post link

This topic was automatically closed 60 days after the last reply. New replies are no longer allowed.