Note:
This topic has been translated from a Chinese forum by GPT and might contain errors.
Original topic: TiDB v6.5 truncate 表tikv 空间不释放
[TiDB Usage Environment] Production Environment
[TiDB Version] v6.5.0
[Reproduction Path] truncate table table_name
[Encountered Problem: Phenomenon and Impact]
Truncate table on 3 large tables, which are 1.4T, 1.3T, and 700G respectively.
The disk space on the TiKV nodes is not being released. The gc_life_time is set to 1 hour, and it has been 5 days, but the space has still not been truly released. The statistics for the 1.4T and 1.3T tables have already become 0, and no more data will be inserted. The 700G table still has applications inserting data.
[Resource Configuration] Go to TiDB Dashboard - Cluster Info - Hosts and take a screenshot of this page
[Attachments: Screenshots/Logs/Monitoring]
Provide feedback in the feedback section. You can try upgrading to a newer 6.5.x version.
Is the GC process running normally? The gc_life_time parameter is set correctly. You can use the pd-ctl tool to check the GC process.
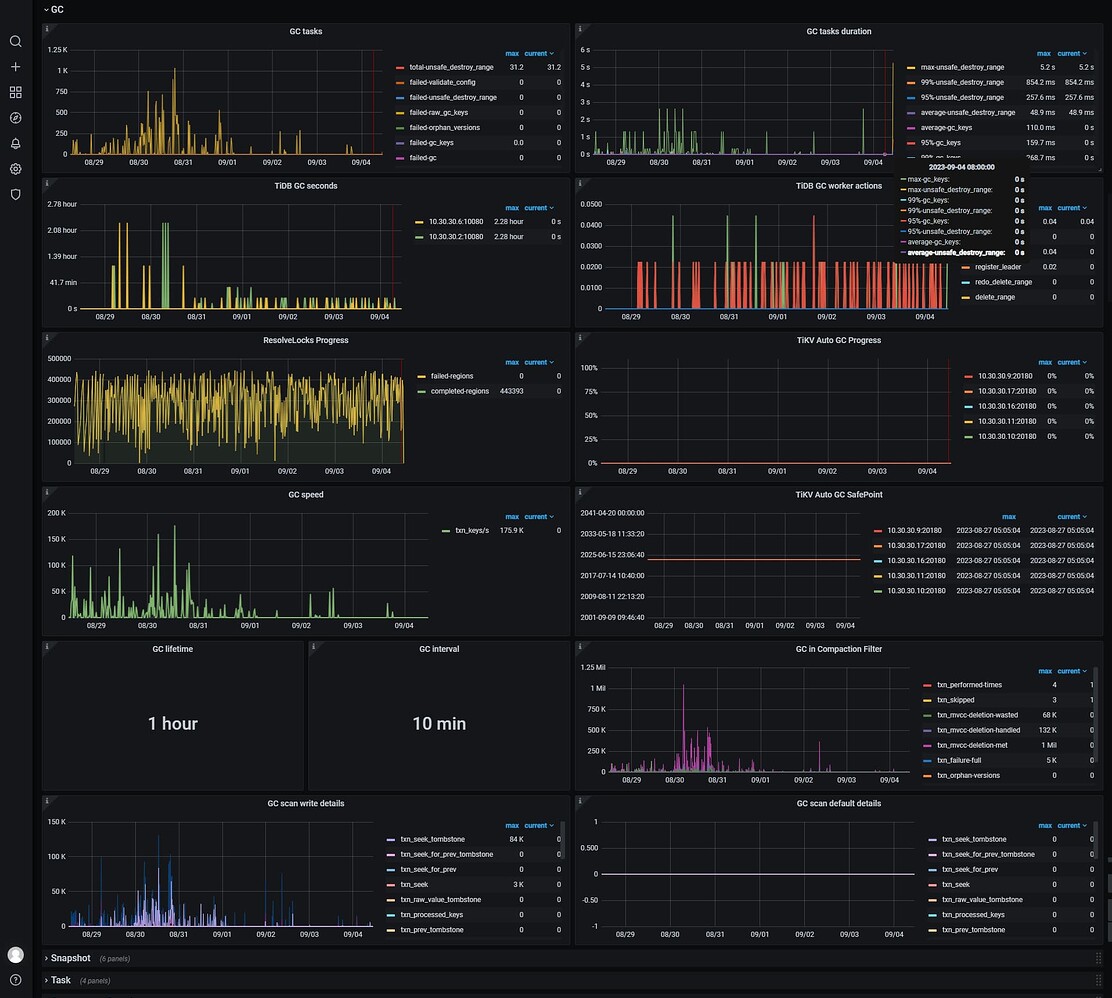
Take a look at the GC page on the TiKV-Details monitoring panel.
Check the corresponding monitoring and look at the GC status.
Check the result of pd-ctl service-gc-safepoint --pd <pd-addrs>.
Starting from the 29th, we began to truncate the table. Looking at the monitoring data from the 29th to the 1st, there was a lot of GC processing, but it decreased significantly afterward.
pd-ctl service-gc-safepoint --pd
Yes, the disk space on the TiKV node is not being released. It is at 85% capacity and still increasing.
GC is stuck. Use pd-ctl tso 443831....... to check the timestamp, it should be June 15th at 23:00 on your monitoring. Find the GC leader’s TiDB node from mysql.tidb and check the tidb.log.
Normally, gc_safe_point should be 0, right?
It started lagging at this time: 2023-08-27 05:05:04.080000
At this point in time, it should be caused by the BR full backup. It has been killed for a while, but it seems that the lock has not been released.
My current gc_safe_point is continuously increasing.
It’s done. The space has been released. Thank you, everyone.
It takes quite a long time to release after killing the br full backup.
If allowed, wouldn’t it be faster to just restart the TiDB server?