Note:
This topic has been translated from a Chinese forum by GPT and might contain errors.
Original topic: tiflash 6.1多副本存储不平衡
To improve efficiency, please provide the following information. Clear problem descriptions can be resolved faster:
[TiDB Usage Environment]
tidb 6.1
[Overview] Scenario + Problem Overview
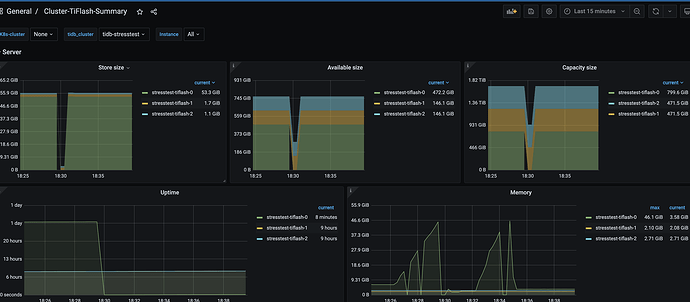
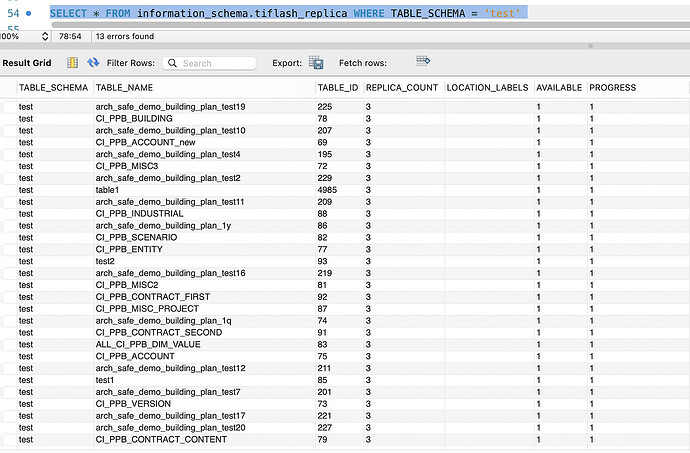
tikv 3 replicas, tiflash 3 replicas, the test database has tiflash 3 replicas enabled, but the data storage is concentrated on tiflash-0, with very little data on tiflash-1 and tiflash-2, and mpp execution is also only on tiflash-0.
Table sharding situation
If the question is about performance optimization or troubleshooting, please download the script and run it. Please select all and copy-paste the terminal output results for uploading.
Could you please clarify the topology? Should TiKV/TiFlash be deployed independently or mixed, and under what specific circumstances? Are the three TiFlash nodes of different specifications?
Are there a total of 3 TiFlash nodes? Does each table with TiFlash replicas have 3 replicas?
Physical machine with 5 nodes, mixed deployment of TiKV and TiFlash.
Three TiFlash nodes, TiFlash replicas, configured three replicas for the test database.
At the beginning, I only used one table for testing, with 3 nodes and 3 replicas. The storage was basically balanced across the 3 nodes, and with MPP enabled for queries, all 3 nodes could be used simultaneously. Later, I added a few more tables, and encountered some issues. After performing a scale-in and then a scale-out, the replicas of the subsequent tables became unbalanced, with data only on the tiflash-0 node.
The capacity and availability of tiflash-0 and the other two nodes differ slightly. You can check the Store Region Score on the PD → Balance page in Grafana. Also, how large is the test database approximately?
The test database currently has 4 replicas, using almost 1TB.
The Store Region Score of tiflash-0 and the other two TiFlash nodes differ significantly. PD is likely trying to schedule, so you should check the PD → Operator page on Grafana to see if any operators have been generated. Additionally, it seems that you have deployed tiflash-1 and tiflash-2 on the same machine, which is highly discouraged. Moreover, this machine has only about 100GB of remaining space, and PD will not schedule onto it if there is insufficient remaining space.
After restarting PD, TiKV, and TiFlash, many scheduling tasks appeared, and it should have started scheduling. It’s very strange why it didn’t schedule before.
Let’s observe a bit longer then.
This topic will be automatically closed 60 days after the last reply. No new replies are allowed.

