TiFlash Instances Missing in Grafana Monitoring Dashboard

Note:
This topic has been translated from a Chinese forum by GPT and might contain errors.

Original topic: grafana 监控看板里,tiflash实例不全

| username: 华健-梦诚科技

tidb v6.1.1

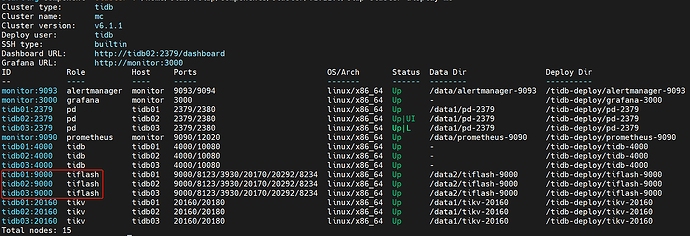
tiup cluster display xxx:

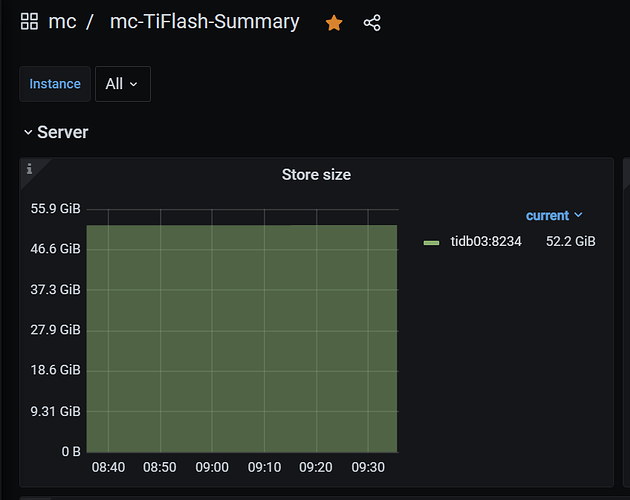
Grafana dashboard:
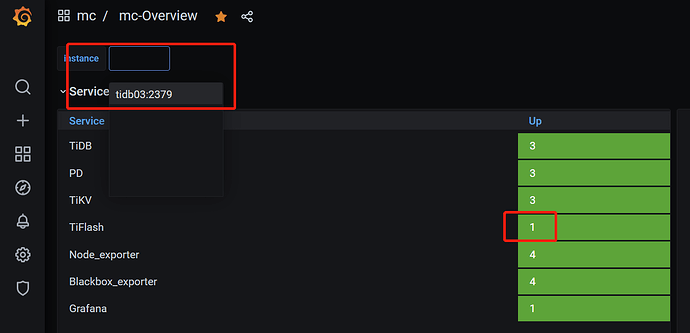
There is only one node in the instance, and the TiFlash replica count shows 1.


What went wrong? How can it be resolved?
| username: songxuecheng | Original post link

Restart Prometheus and Grafana.

| username: WalterWj | Original post link

Reload monitoring components under tiup cluster

| username: 华健-梦诚科技 | Original post link

Got it, thank you.

| username: system | Original post link

This topic was automatically closed 60 days after the last reply. New replies are no longer allowed.