Note:
This topic has been translated from a Chinese forum by GPT and might contain errors.
Original topic: tiflash由于句柄数升高导致重启
【TiDB Usage Environment】Production Environment
【TiDB Version】6.1.0
【Encountered Problem】tiflash restart
【Problem Phenomenon and Impact】
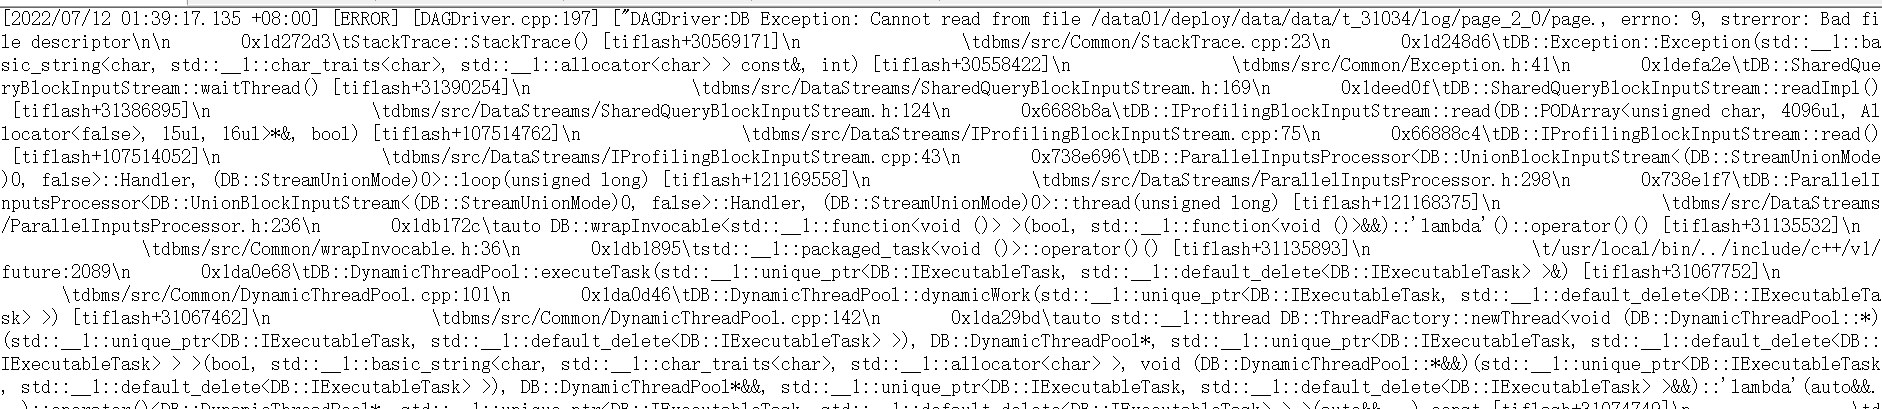
tiflash_error.log:
tiflash-summary:
tidb-cluster-node_exporter:
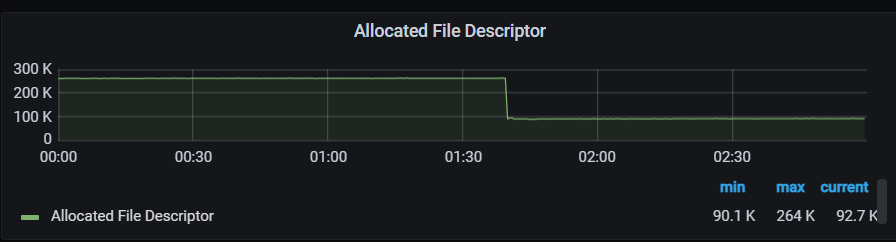
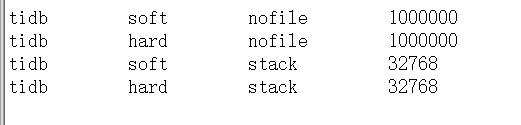
Operating System Configuration:
Is there any prompt information in the system message? Is there any hint like oom-killer?
It wasn’t caused by OOM, the message shows: main process exited, code=killed
Root cause investigation:
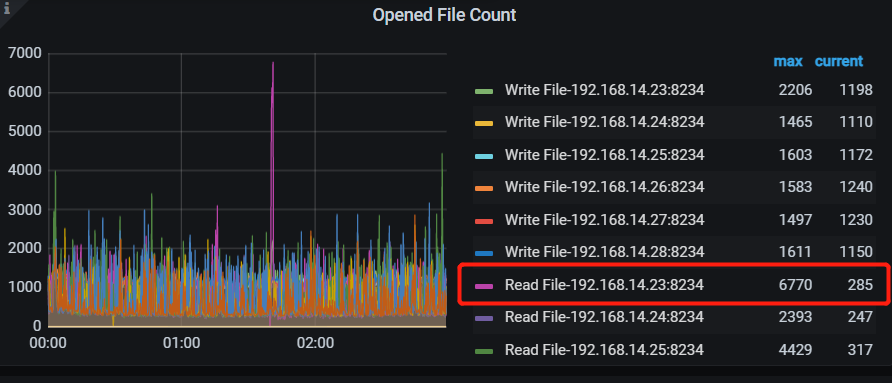
- The open file count is indeed relatively high, but is there a message indicating “open too many file descriptor …”?
- 6770 may not be the actual limit value; it could have been averaged out, and the maximum value might be higher than this.
As for avoidance, if this is the root cause, can you try setting it to unlimited to see if it can bypass the issue?
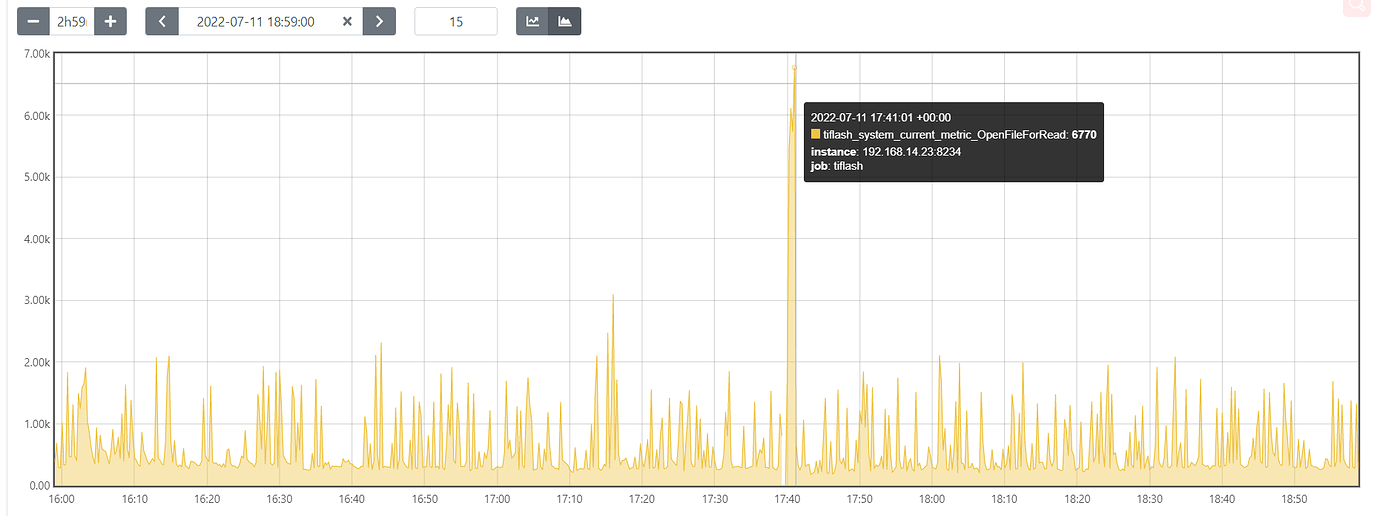
- Use port 9090 to check the instantaneous value recorded by the Prometheus metric (which is also averaged);
- Do you still have the logs from when TiFlash was restarted (tiflash.log, tiflash_error.log)? Please post them.
The current information is not easy to analyze further…
Could you please confirm if this is a TiFlash log? It looks more like a TiKV log.
The ng_monitor export should only be tiflash_tikv.log. Please go to that directory and retrieve all the logs corresponding to these 4 time points.
Yes, the exported file is tiflash_tikv.log, the tiflash.log at that time is no longer available.
Occasionally it happens, this is the tiflash_error.log during the issue period:
tiflash_error.log (115.3 KB)
OK, does it return to normal successfully every time you restart?
After the restart, the number of handles decreased, and the service is normal.
Sure,
- Please confirm the operating system version;
- Please confirm whether the continuous profiling feature is enabled on TiFlash (you can see it on the dashboard); or if there is any manual profiling.
This might be the issue, still confirming → query raise the error of Unknown compression method: 200 when profiling in rhel 8 · Issue #5292 · pingcap/tiflash · GitHub
Based on the judgment, it is basically related to this issue → query raise the error of Unknown compression method: 200 when profiling in rhel 8 · Issue #5292 · pingcap/tiflash · GitHub
Suggestions:
- Turn off continuous profiling and observe whether this phenomenon still occurs;
- You can follow this issue, and we will continue to investigate and fix the problem internally;
If there are any new developments or phenomena, you can also post them here. Thank you for the feedback.
Sure, thanks for the help~
This topic was automatically closed 1 minute after the last reply. No new replies are allowed.