Note:
This topic has been translated from a Chinese forum by GPT and might contain errors.Original topic: TiFlash 重启,内存&CPU 资源耗尽,系统卡死
[TiDB Usage Environment] Production Environment
[TiDB Version] 6.5.1
[Reproduction Path] Enable TiFlash for some tables
[Encountered Problem: Symptoms and Impact] Restarting one of the TiFlash nodes results in CPU & memory resource exhaustion, system freeze, and inability to start TiFlash.
[Resource Configuration]
[Attachments: Screenshots/Logs/Monitoring]
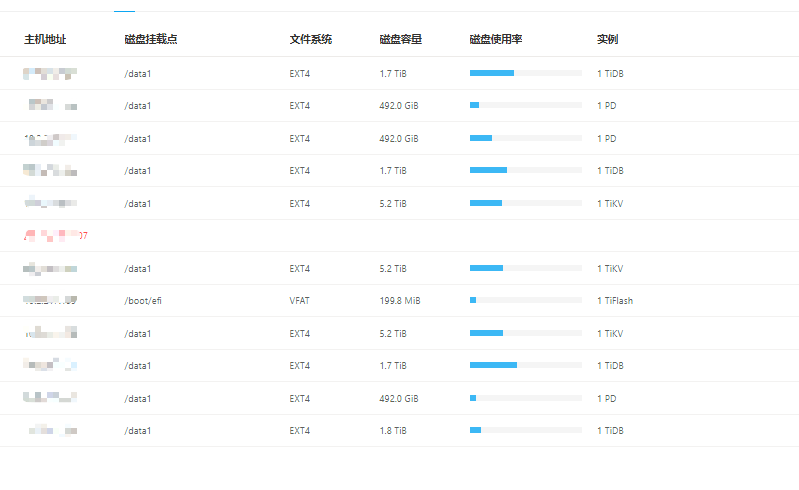
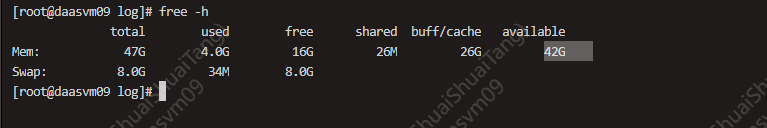
Two TiFlash nodes are allocated 47G each. One node recovers normally after a restart with available memory.
The other node, upon restart, leads to CPU & memory exhaustion, causing the system to freeze and TiFlash to fail to start.
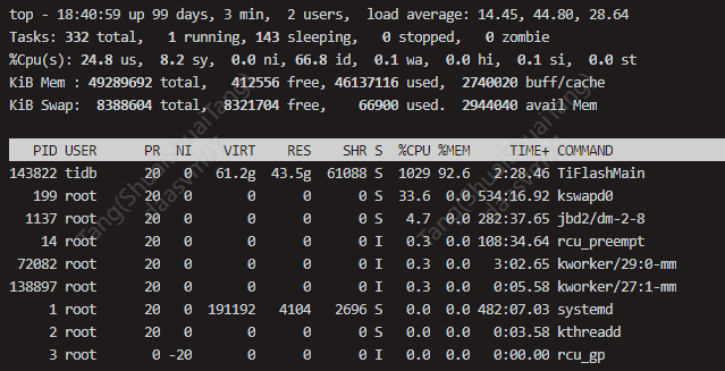
Checking the problematic TiFlash node’s tiflash_error log, the following logs are printed before the system freezes:
[2024/06/13 18:29:31.326 +08:00] [WARN] [StorageConfigParser.cpp:241] [“The configuration "path" is deprecated. Check [storage] section for new style.”] [thread_id=1]
[2024/06/13 18:29:47.022 +08:00] [WARN] [DMFile.cpp:732] [“Existing temporary or dropped dmfile, removed: /data1/tidb-data/tiflash-9000/data/t_21836383/stable/.tmp.dmf_10142635”] [source=DMFile] [thread_id=51]
[2024/06/13 18:30:52.892 +08:00] [WARN] [SchemaGetter.cpp:208] [“The schema diff for version 11163789, key Diff:11163789 is empty.”] [source=SchemaGetter] [thread_id=54]
[2024/06/13 18:39:21.252 +08:00] [WARN] [StorageConfigParser.cpp:241] [“The configuration "path" is deprecated. Check [storage] section for new style.”] [thread_id=1]
[2024/06/13 18:39:37.601 +08:00] [WARN] [DMFile.cpp:732] [“Existing temporary or dropped dmfile, removed: /data1/tidb-data/tiflash-9000/data/t_21836383/stable/.tmp.dmf_10142639”] [source=DMFile] [thread_id=51]
[2024/06/13 18:50:22.504 +08:00] [WARN] [StorageConfigParser.cpp:241] [“The configuration "path" is deprecated. Check [storage] section for new style.”] [thread_id=1]
[2024/06/13 18:50:39.733 +08:00] [WARN] [DMFile.cpp:732] [“Existing temporary or dropped dmfile, removed: /data1/tidb-data/tiflash-9000/data/t_21836383/stable/.tmp.dmf_10142643”] [source=DMFile] [thread_id=51]
[2024/06/13 19:05:44.285 +08:00] [ERROR] [] [“get member failed: 4: Deadline Exceeded”] [source=pingcap.pd] [thread_id=99]
[2024/06/13 19:05:44.302 +08:00] [WARN] [PageDirectory.cpp:1519] [“Meet a stale snapshot [thread id=64] [tracing id=write] [seq=91675760] [alive time(s)=819.093752026]”] [source=global.meta] [thread_id=69]
[2024/06/13 19:05:44.302 +08:00] [WARN] [PageDirectory.cpp:1519] [“Meet a stale snapshot [thread id=97] [tracing id=write] [seq=91675776] [alive time(s)=818.760227131]”] [source=global.meta] [thread_id=69]
[2024/06/13 19:05:44.312 +08:00] [WARN] [] [“failed to get cluster id by :http://xxxx:2379”] [source=pingcap.pd] [thread_id=99]
[2024/06/13 19:05:44.363 +08:00] [ERROR] [] [“Send TsoRequest failed”] [source=pingcap.pd] [thread_id=102]
[2024/06/13 19:05:44.364 +08:00] [WARN] [PageDirectory.cpp:1519] [“Meet a stale snapshot [thread id=64] [tracing id=write] [seq=21915395] [alive time(s)=819.180260066]”] [source=global.data] [thread_id=69]
[2024/06/13 19:05:44.365 +08:00] [WARN] [PageDirectory.cpp:1519] [“Meet a stale snapshot [thread id=97] [tracing id=write] [seq=21915397] [alive time(s)=818.823370803]”] [source=global.data] [thread_id=69]
[2024/06/13 19:05:44.403 +08:00] [WARN] [] [“update ts error: Exception: Send TsoRequest failed”] [source=pd/oracle] [thread_id=102]
How can this issue be resolved?