Hello everyone,
I’m facing an issue with TiFlash after upgrade my TiDB cluster from v5.4 to v7.5.
A days after the upgrade, I realized that the data became out of sync between TiKV and TiFlash. The query via TiFlash returned almost empty data. When show tiflash_replica, all of my table progress is back to 0 or something not 1 but avaiable still 1.
+----------+---------------+-----------+----------+
| TABLE_ID | REPLICA_COUNT | AVAILABLE | PROGRESS |
+----------+---------------+-----------+----------+
|   460166 |             2 |         1 |      0.5 |
|   396090 |             2 |         1 |        0 |
|   396886 |             2 |         1 |        0 |
|   397221 |             2 |         1 |        0 |
|   397295 |             2 |         1 |        0 |
+----------+---------------+-----------+----------+
After that, I decided to set all replica to 0, scale-in all 2 of my TiFlash node, waiting end of Pending Offline, prune its and scale-out them into cluster again. After set replica to 2 for my tables again, the replication is run normally. After replication of all tables completed, my query on TiFlash is on-sync again. But after about 1 days, the issue occurred again I did more 2 times scale-in scale-out, the issue still hasn’t been resolved.
Application environment:
Production
TiDB version:
v7.5.0
Reproduction method:
Set TiFlash replica of all table to 0, scale-in, scale-out and set to 2 again.
Problem:
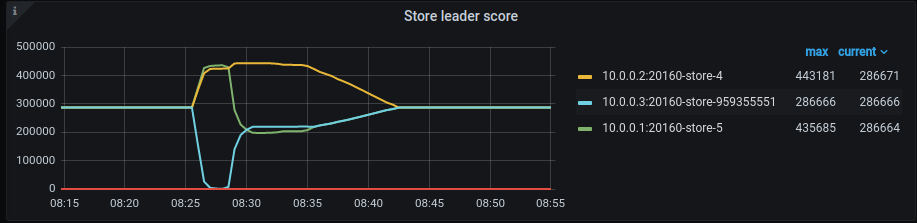
After several attempts, I realized they all shared the same scenario. After all of tables had completed the replication about 1 days. 1 of TiKV node evicted all leader region and then rebalance again (1)
The evicted TiKV node log raised some ERROR like this
[2024/02/21 08:37:27.278 +07:00] [ERROR] [peer.rs:5351] ["failed to send extra message"] [err_code=KV:Raftstore:Transport] [err=Transport(Full)] [target="id: 1020098876 store_id: 5"] [peer_id=1020785306] [region_id=1020098875] [type=MsgHibernateResponse] [thread_id=0x5]
[2024/02/21 08:37:27.280 +07:00] [ERROR] [peer.rs:5351] ["failed to send extra message"] [err_code=KV:Raftstore:Transport] [err=Transport(Full)] [target="id: 1065360228 store_id: 5"] [peer_id=977883503] [region_id=977883502] [type=MsgHibernateRequest] [thread_id=0x5]
and re-join with this log
[2024/02/21 08:37:27.369 +07:00] [INFO] [raft.rs:2345] ["[term 219] received MsgTimeoutNow from 1019902187 and starts an election to get leadership."] [from=1019902187] [term=219] [raft_id=1019902186] [region_id=1019902184] [thread_id=0x5]
[2024/02/21 08:37:27.369 +07:00] [INFO] [raft.rs:1532] ["starting a new election"] [term=219] [raft_id=1019902186] [region_id=1019902184] [thread_id=0x5]
[2024/02/21 08:37:27.369 +07:00] [INFO] [raft.rs:1151] ["became candidate at term 220"] [term=220] [raft_id=1019902186] [region_id=1019902184] [thread_id=0x5]
I don’t think it have OOM kill or restart occurred here.
But after that, two TiFlash node have some strange log and data on TiFlash become empty.
2024/02/21 09:06:17.072 +07:00] [INFO] [TiDBSchemaSyncer.cpp:72] ["Start to sync schemas. current version is: 759513 and try to sync schema version to: 759516"] [source="keyspace=4294967295"] [thread_id=547]
[2024/02/21 09:06:17.072 +07:00] [INFO] [SchemaBuilder.cpp:1235] ["Storage instance does not exist, applyDropTable is ignored, table_id=462125"] [source="keyspace=4294967295"] [thread_id=547]
[2024/02/21 09:06:17.072 +07:00] [INFO] [SchemaBuilder.cpp:1235] ["Storage instance does not exist, applyDropTable is ignored, table_id=462125"] [source="keyspace=4294967295"] [thread_id=547]
[2024/02/21 09:06:17.072 +07:00] [INFO] [SchemaBuilder.cpp:1235] ["Storage instance does not exist, applyDropTable is ignored, table_id=462125"] [source="keyspace=4294967295"] [thread_id=547]
[2024/02/21 09:06:17.073 +07:00] [INFO] [TiDBSchemaSyncer.cpp:106] ["End sync schema, version has been updated to 759516"] [source="keyspace=4294967295"] [thread_id=547]
[2024/02/21 09:06:17.073 +07:00] [INFO] [SchemaSyncService.cpp:218] ["Schema GC begin, last_safepoint=447867365903564800 safepoint=447867787011424256"] [source="keyspace=4294967295"] [thread_id=547]
[2024/02/21 09:06:17.074 +07:00] [INFO] [SchemaSyncService.cpp:256] ["Detect stale table, database_name=db_102178 table_name=t_102758 database_tombstone=447867472962912264 table_tombstone=0 safepoint=447867787011424256"] [thread_id=547]
[2024/02/21 09:06:17.074 +07:00] [INFO] [SchemaSyncService.cpp:256] ["Detect stale table, database_name=db_102178 table_name=t_109756 database_tombstone=447867472962912264 table_tombstone=0 safepoint=447867787011424256"] [thread_id=547]
[2024/02/21 09:06:17.074 +07:00] [INFO] [SchemaSyncService.cpp:256] ["Detect stale table, database_name=db_102178 table_name=t_242598 database_tombstone=447867472962912264 table_tombstone=0 safepoint=447867787011424256"] [thread_id=547]
[2024/02/21 09:06:17.074 +07:00] [INFO] [SchemaSyncService.cpp:256] ["Detect stale table, database_name=db_102178 table_name=t_244574 database_tombstone=447867472962912264 table_tombstone=0 safepoint=447867787011424256"] [thread_id=547]
[2024/02/21 09:06:17.074 +07:00] [INFO] [SchemaSyncService.cpp:256] ["Detect stale table, database_name=db_102178 table_name=t_244959 database_tombstone=447867472962912264 table_tombstone=0 safepoint=447867787011424256"] [thread_id=547]
[2024/02/21 09:06:17.074 +07:00] [INFO] [SchemaSyncService.cpp:256] ["Detect stale table, database_name=db_102178 table_name=t_266566 database_tombstone=447867472962912264 table_tombstone=0 safepoint=447867787011424256"] [thread_id=547]
[2024/02/21 09:06:17.074 +07:00] [INFO] [SchemaSyncService.cpp:256] ["Detect stale table, database_name=db_102178 table_name=t_266569 database_tombstone=447867472962912264 table_tombstone=0 safepoint=447867787011424256"] [thread_id=547]
...
[2024/02/21 09:06:17.519 +07:00] [DEBUG] [Segment.h:564] ["Abandon segment, segment=<segment_id=4298 epoch=2 range=[150120936,9223372036854775807)>"] [source="keyspace=4294967295 table_id=102758 segment_id=4298 epoch=2"] [thread_id=547]
[2024/02/21 09:06:17.523 +07:00] [INFO] [Segment.cpp:2193] ["Finish segment drop its next segment, segment=<segment_id=3743 epoch=2 range=[149416825,149771152) next_segment_id=4358 delta_rows=0 delta_bytes=0 delta_deletes=0 stable_file=dmf_443 stable_rows=354327 stable_bytes=447953897 dmf_rows=354327 dmf_bytes=447953897 dmf_packs=44>"] [source="keyspace=4294967295 table_id=102758 segment_id=3743 epoch=2"] [thread_id=547]
[2024/02/21 09:06:17.523 +07:00] [DEBUG] [Segment.h:564] ["Abandon segment, segment=<segment_id=4358 epoch=3 range=[149771152,9223372036854775807)>"] [source="keyspace=4294967295 table_id=102758 segment_id=4358 epoch=3"] [thread_id=547]
[2024/02/21 09:06:17.527 +07:00] [INFO] [Segment.cpp:2193] ["Finish segment drop its next segment, segment=<segment_id=4355 epoch=1 range=[149066160,149416825) next_segment_id=3743 delta_rows=0 delta_bytes=0 delta_deletes=0 stable_file=dmf_8594 stable_rows=350665 stable_bytes=446287464 dmf_rows=350665 dmf_bytes=446287464 dmf_packs=44>"] [source="keyspace=4294967295 table_id=102758 segment_id=4355 epoch=1"] [thread_id=547]
[2024/02/21 09:06:17.527 +07:00] [DEBUG] [Segment.h:564] ["Abandon segment, segment=<segment_id=3743 epoch=3 range=[149416825,9223372036854775807)>"] [source="keyspace=4294967295 table_id=102758 segment_id=3743 epoch=3"] [thread_id=547]
[2024/02/21 09:06:17.530 +07:00] [INFO] [Segment.cpp:2193] ["Finish segment drop its next segment, segment=<segment_id=4349 epoch=2 range=[148724627,149066160) next_segment_id=4355 delta_rows=0 delta_bytes=0 delta_deletes=0 stable_file=dmf_8593 stable_rows=341533 stable_bytes=442448793 dmf_rows=341533 dmf_bytes=442448793 dmf_packs=43>"] [source="keyspace=4294967295 table_id=102758 segment_id=4349 epoch=2"] [thread_id=547]
...
and then
[2024/02/21 09:06:29.384 +07:00] [ERROR] [TiDBSchemaSyncer.cpp:252] ["Can not find related database_id and logical_table_id from table_id_map, sync table schema fail. physical_table_id=315048"] [source="keyspace=4294967295"] [thread_id=538]
[2024/02/21 09:06:29.401 +07:00] [ERROR] [TiDBSchemaSyncer.cpp:252] ["Can not find related database_id and logical_table_id from table_id_map, sync table schema fail. physical_table_id=315054"] [source="keyspace=4294967295"] [thread_id=536]
[2024/02/21 09:06:30.412 +07:00] [ERROR] [TiDBSchemaSyncer.cpp:252] ["Can not find related database_id and logical_table_id from table_id_map, sync table schema fail. physical_table_id=266566"] [source="keyspace=4294967295"] [thread_id=540]
...
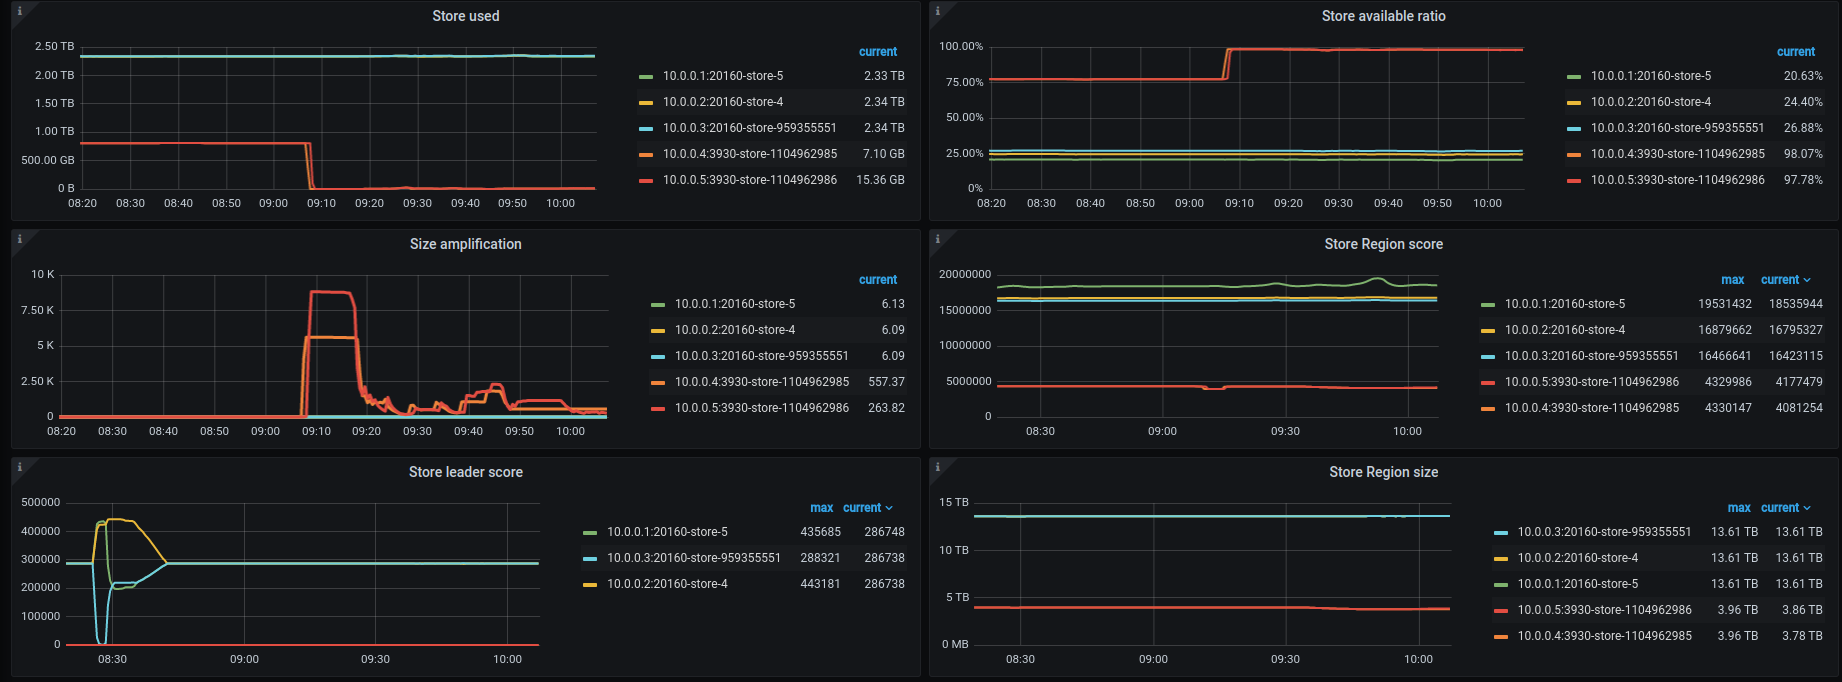
As (2) image below, data on 2 TiFlash (10.0.0.4-5) node is gone but region size still not decrease. All TiFlash query at this time is return an not accurate result but TiKV query is normal.
If set replica to 0 and re-set them to 2 again, to TiFlash node become Disconnect and then Down with some not-sync error.
Retry scale-in scale-out at 3rd attemp still have same issue.
Resource allocation:
3 TiDB node: 32 CPU, 128 GB RAM, 500 GB SSD disk, 10GBitS NIC
3 PD node: deploy on same TiDB node
3 TiKV node: 40 CPU, 128 GB RAM, 3.5 TB SSD disk, 10GBitS NIC (10.0.0.1-3)
2 TiFlash node: 48 CPU, 128 GB RAM, 3.5TB SSD disk, 10GBitS NIC (10.0.0.4-5)
Attachment:
(1)
(2)