Note:
This topic has been translated from a Chinese forum by GPT and might contain errors.
Original topic: tikv和tidb最近一直出现重启现象
【TiDB Usage Environment】Production Environment
【TiDB Version】v5.2.1
【Encountered Problem】Frequent restarts of TiKV and TiDB recently
【Reproduction Path】Cannot reproduce
【Problem Phenomenon and Impact】
Impact: During leader election after a restart, it is very sluggish, and SQL query latency is very high.
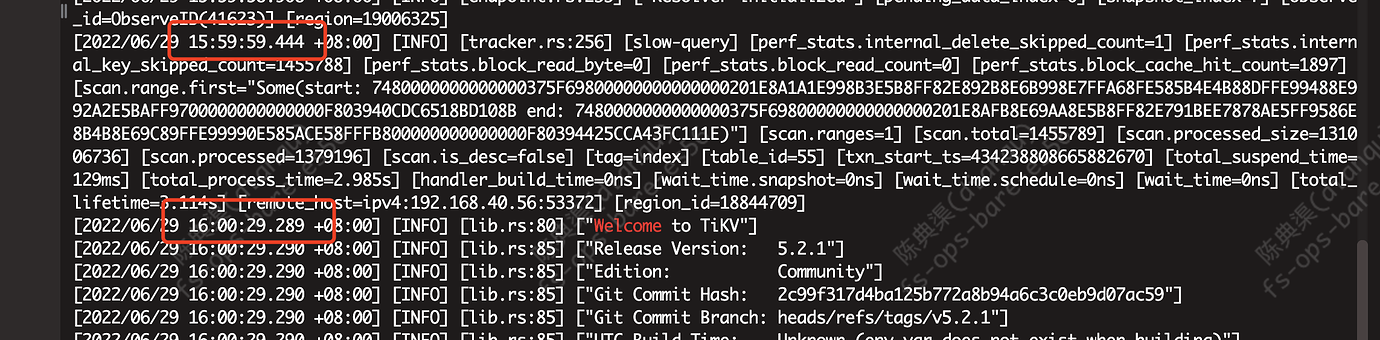
Problem Phenomenon: The TiKV log shows “welcome tikv” (indicating a restart, with a log gap of several seconds before and after)
Monitoring files:
b2b-Overview_2022-06-30T07_27_39.411Z.json (2.2 MB)
b2b-TiKV-Details_2022-06-30T06_11_35.859Z.json (25.5 MB)
b2b-TiDB_2022-06-30T07_26_34.011Z.json (5.1 MB) b2b-Overview_2022-06-30T07_27_39.411Z.json
b2b-TiKV-Details_2022-06-30T06_11_35.859Z.json
b2b-TiDB_2022-06-30T07_26_34.011Z.json
Take a look at the logs of TiKV and TiDB.
One moment, I’ll export the monitoring data shortly.
There is a log folder in the deployment directory of each component of your cluster. You can check the logs there, which is the most straightforward way.
This is the nearby abnormal log.
Link: 百度网盘 请输入提取码 Extraction code: lmnl
–Shared by Baidu Netdisk Super Member v6. The complete content is stored in Baidu Netdisk.
Check /var/log/messages to see the reason for the restart. Could it be due to an OOM (Out of Memory) issue?
It’s possible. Check the memory usage monitoring at that time.
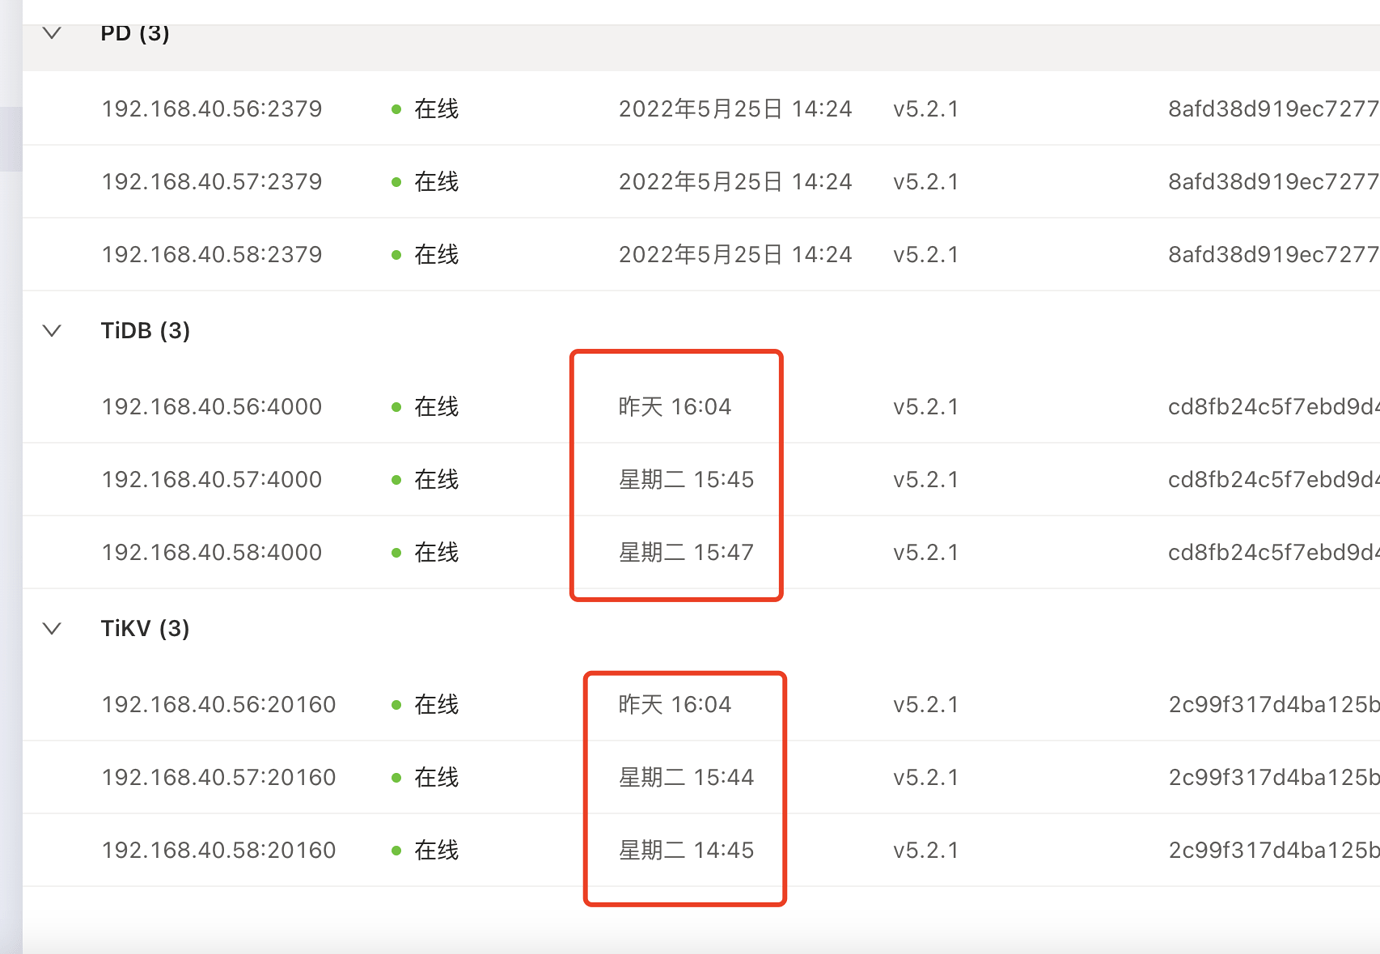
From the monitoring, it looks like a typical OOM. The machine 56 experienced an OOM.
Okay, thank you very much.
The issue was finally resolved. The specific problem was due to a memory leak after TiDB GC failure, causing the memory to only increase and not decrease. Since TiDB and TiKV were deployed on the same node, when the system killed the application, it killed TiKV. After TiKV restarted, TiDB was killed again due to insufficient memory. Finally, by investigating the GC anomalies (mainly errors concentrated on analyze taking too long), we adjusted the tidb_gc_life_time parameter. The remaining issue was that the field was too short, causing collection failures (统计信息收集报错 Data too long for column 'upper_bound' - TiDB 的问答社区).
This is a mixed deployment. PD, TiKV, and TiDB must be deployed separately.
If you do mixed deployment, you must limit the memory usage of TiKV and TiDB.
Otherwise, a 1GB SQL query will cause an OOM.
You can’t control developers writing bad SQL, so it’s best to have TiDB on a separate machine.
Yes, mainly because resources are not enough right now, we still need to wait for a while.
This topic was automatically closed 1 minute after the last reply. No new replies are allowed.