Note:
This topic has been translated from a Chinese forum by GPT and might contain errors.
Original topic: tikv内存超过block-cache设置的值
【TiDB Usage Environment】Production Environment
【TiDB Version】5.4
【Encountered Problem】TiKV memory usage remains high, are there any other parameters?
【Reproduction Path】None
【Problem Phenomenon and Impact】
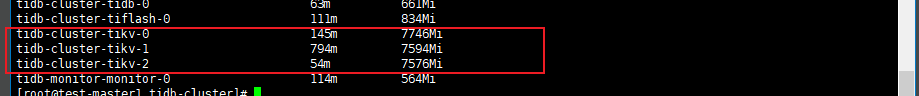
TiKV memory is not being released, causing insufficient cluster resources
【Attachments】
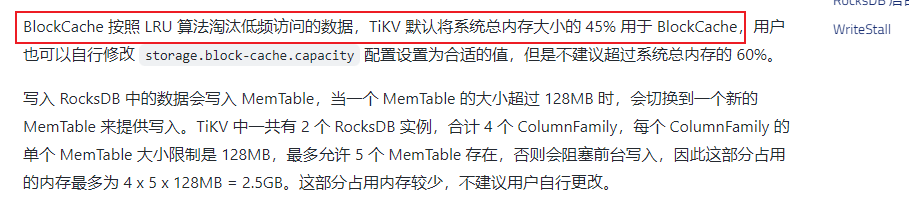
TiKV memory usage generally consists of storage.block-cache.capacity plus 2.5GB, which is the memory size occupied by the memtable.
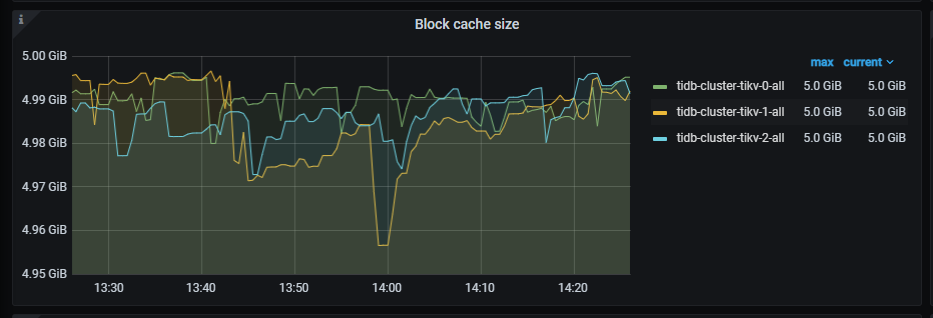
From the monitoring, it seems that this parameter has already taken effect, but the memory usage keeps increasing.
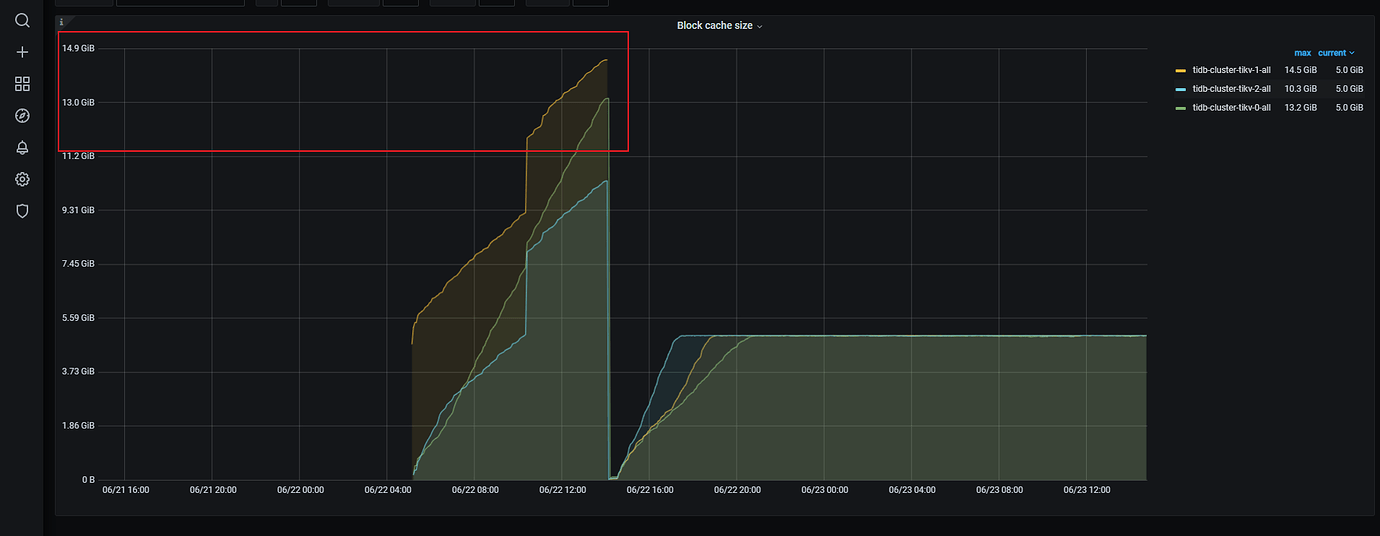
This statement seems to have an issue. When I didn’t configure this parameter, it was said that the default is 45% of the memory, but in reality, it will consume the cluster resources until they are fully used.
Is there only one TiKV instance on the server? From the monitoring, what was the previous Block cache size value? If you are worried about the TiKV process excessively using memory, you can also use the memory_limit in resource_control to limit its total memory usage.
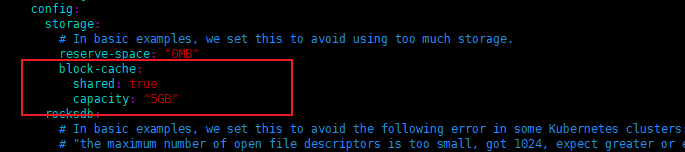
Previously, I modified storage.block-cache.capacity to 5G. Now, according to the monitoring, it is indeed 5G, but the resources used by the pod have already reached 7G. Multiple nodes, one node per TiKV.
I’m not very familiar with containers. I suggest explicitly setting the block-cache and then observing.
I have already set it up, but there is no effect after the setup. I’m asking what’s going on.
After setting the block-cache to 5GB, the total memory usage should reach around 7.5GB at its peak, and it might be slightly higher sometimes, as the coprocessor occasionally needs to cache data.
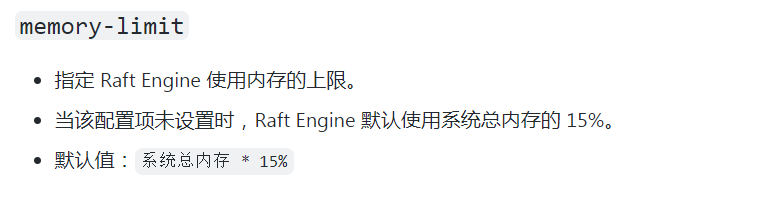
Are you saying that the value of memory_limit plus the value of block-cache is the total memory used by TiKV?
What you mentioned is not the same memory_limit. What you posted is the configuration of the raft engine. Please refer to a question I mentioned earlier:
The official documentation says that you only need to set the shared parameter “storage,” but now that it is set, it doesn’t work. The total memory exceeds the set value. I just want to know why it exceeds?
Currently, the memory usage of your TiKV nodes is high. I think you can check the related memory configuration parameters.
You can refer to: TiKV 内存参数性能调优 | PingCAP 文档中心
I followed the instructions in the link you provided, did not execute any SQL statements, only performed insert operations.
Building on this question, does this require reserving some memory as the system’s page cache? Is this autonomously set by TiDB based on the system’s situation, or is there a default configuration in the configuration file? If it’s in the configuration file, can it be modified?
This should mean that the total memory configuration of TiKV is less than the total system memory, and the remaining part is for the operating system to use.
If in the scenario of a K8S cluster, I limit the memory resources of the POD where TIKV is located, for example, to 10G, what will happen to the TIKV service when the memory usage of this POD reaches 10G? How will the subsequent data be handled?
I haven’t used k8s, so I’m not very familiar with it.
You can observe for a period of time. Is your current workload high?
Is it possible that the release process takes time, and it might be slower when the workload is high?