TiKV Raft Unable to Elect

Note:
This topic has been translated from a Chinese forum by GPT and might contain errors.

Original topic: tivk raft 无法选举

| username: 末0_0想

[TiDB Usage Environment] Test
[TiDB Version] 6.5.0
[Reproduction Path]
I found that there are only two TiKV nodes when modifying the configuration.
(show config where type = ‘tikv’ and name like ‘%enable-compaction-filter%’:wink:


Then I used SHOW CONFIG LIKE ‘tikv’; and also found only two nodes.
I checked the cluster status, and the cluster status is normal.

I logged into the machine and checked the TiKV log information and found a large number of election logs in the logs.

Can any expert help me see what the problem is?

Also, my monitoring has been alerting me that 5 services are offline. How should I troubleshoot this?

| username: xfworld | Original post link

Check the cluster status through the Dashboard.

Did you perform any operations before that might have caused the current state?

| username: TiDBer_jYQINSnf | Original post link

Use pd-ctl store to check the status of the store. Take a screenshot. For example, check if there is something like is_busy.
Then, check the logs on the downed TiKV to see what the last log entries are.
Additionally, check if the network between this TiKV and other nodes is connected.

| username: 末0_0想 | Original post link

Previously, I performed a migration of the cluster Deploy Dir. I used the method described in the article - Practical Guide to Modifying Cluster Directory with TiUP | TiDB Community. The cluster check and cluster status were appropriate.


After running tiup cluster check zdww-tidb --cluster, there were no issues with the cluster.

| username: 末0_0想 | Original post link

The network is sometimes connected.
image
There is no ERROR information in the log.

There is no down information in the log, it is just constantly electing.
Attached are the node logs, please take a look.
tikv.rar (3.2 MB)

| username: 末0_0想 | Original post link

Can any experts help take a look?

| username: TiDBer_jYQINSnf | Original post link

Have you checked the network connectivity?
Use pd-ctl store to check the information of this TiKV and bring it here.

| username: 末0_0想 | Original post link

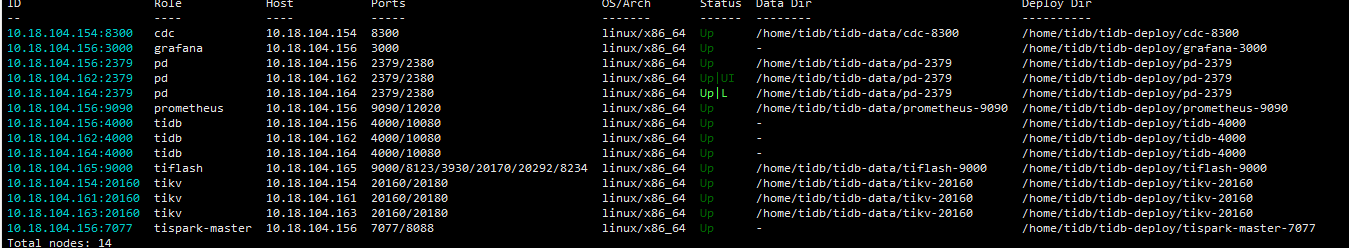
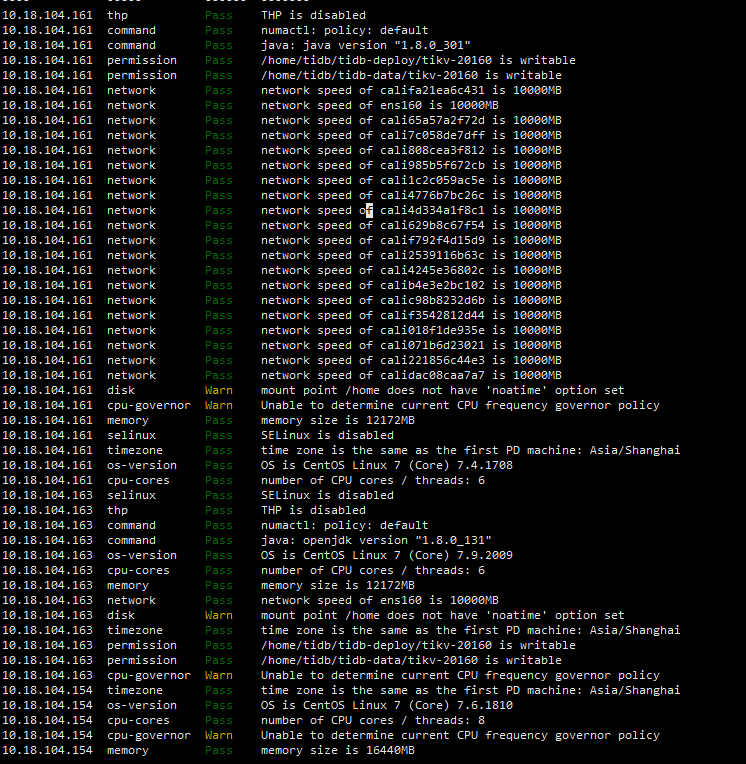
The network is connected, and ping is OK. Here is the node information:

Starting component `ctl`: /home/tidb/.tiup/components/ctl/v6.5.0/ctl pd -u http://10.18.104.156:2379 -i
» store 
{
  "count": 4,
  "stores": [
    {
      "store": {
        "id": 1,
        "address": "10.18.104.161:20160",
        "version": "6.5.0",
        "peer_address": "10.18.104.161:20160",
        "status_address": "10.18.104.161:20180",
        "git_hash": "47b81680f75adc4b7200480cea5dbe46ae07c4b5",
        "start_timestamp": 1685072490,
        "deploy_path": "/home/tidb/tidb-deploy/tikv-20160/bin",
        "last_heartbeat": 1685357940322646958,
        "state_name": "Up"
      },
      "status": {
        "capacity": "116.9GiB",
        "available": "52.15GiB",
        "used_size": "10.91GiB",
        "leader_count": 118,
        "leader_weight": 1,
        "leader_score": 118,
        "leader_size": 385,
        "region_count": 332,
        "region_weight": 1,
        "region_score": 83519.07268055658,
        "region_size": 9142,
        "witness_count": 0,
        "slow_score": 1,
        "start_ts": "2023-05-26T11:41:30+08:00",
        "last_heartbeat_ts": "2023-05-29T18:59:00.322646958+08:00",
        "uptime": "79h17m30.322646958s"
      }
    },
    {
      "store": {
        "id": 2,
        "address": "10.18.104.163:20160",
        "version": "6.5.0",
        "peer_address": "10.18.104.163:20160",
        "status_address": "10.18.104.163:20180",
        "git_hash": "47b81680f75adc4b7200480cea5dbe46ae07c4b5",
        "start_timestamp": 1685342282,
        "deploy_path": "/home/tidb/tidb-deploy/tikv-20160/bin",
        "last_heartbeat": 1685357943424142105,
        "state_name": "Up"
      },
      "status": {
        "capacity": "116.9GiB",
        "available": "47.55GiB",
        "used_size": "11.25GiB",
        "leader_count": 0,
        "leader_weight": 1,
        "leader_score": 0,
        "leader_size": 0,
        "region_count": 332,
        "region_weight": 1,
        "region_score": 491046795.2541935,
        "region_size": 9142,
        "witness_count": 0,
        "slow_score": 1,
        "start_ts": "2023-05-29T14:38:02+08:00",
        "last_heartbeat_ts": "2023-05-29T18:59:03.424142105+08:00",
        "uptime": "4h21m1.424142105s"
      }
    },
    {
      "store": {
        "id": 179,
        "address": "10.18.104.165:3930",
        "labels": [
          {
            "key": "engine",
            "value": "tiflash"
          }
        ],
        "version": "v6.5.0",
        "peer_address": "10.18.104.165:20170",
        "status_address": "10.18.104.165:20292",
        "git_hash": "41c08dbe20901f6cfd28ce642b39ce53f35ef48a",
        "start_timestamp": 1684824077,
        "deploy_path": "/home/tidb/tidb-deploy/tiflash-9000/bin/tiflash",
        "last_heartbeat": 1685357943309588754,
        "state_name": "Up"
      },
      "status": {
        "capacity": "116.9GiB",
        "available": "69.35GiB",
        "used_size": "1B",
        "leader_count": 0,
        "leader_weight": 1,
        "leader_score": 0,
        "leader_size": 0,
        "region_count": 0,
        "region_weight": 1,
        "region_score": 0,
        "region_size": 0,
        "witness_count": 0,
        "slow_score": 1,
        "start_ts": "2023-05-23T14:41:17+08:00",
        "last_heartbeat_ts": "2023-05-29T18:59:03.309588754+08:00",
        "uptime": "148h17m46.309588754s"
      }
    },
    {
      "store": {
        "id": 31001,
        "address": "10.18.104.154:20160",
        "version": "6.5.0",
        "peer_address": "10.18.104.154:20160",
        "status_address": "10.18.104.154:20180",
        "git_hash": "47b81680f75adc4b7200480cea5dbe46ae07c4b5",
        "start_timestamp": 1685072396,
        "deploy_path": "/home/tidb/tidb-deploy/tikv-20160/bin",
        "last_heartbeat": 1685357936559721705,
        "state_name": "Up"
      },
      "status": {
        "capacity": "145GiB",
        "available": "110.3GiB",
        "used_size": "9.073GiB",
        "leader_count": 214,
        "leader_weight": 1,
        "leader_score": 214,
        "leader_size": 8757,
        "region_count": 332,
        "region_weight": 1,
        "region_score": 33211.80239468139,
        "region_size": 9142,
        "witness_count": 0,
        "slow_score": 1,
        "start_ts": "2023-05-26T11:39:56+08:00",
        "last_heartbeat_ts": "2023-05-29T18:58:56.559721705+08:00",
        "uptime": "79h19m0.559721705s"
      }
    }
  ]
}
| username: TiDBer_jYQINSnf | Original post link

Look, this TiKV is also sending heartbeats. Is there a scheduler for evicting leaders?
Can you check with pd-ctl scheduler show?
I can’t think of any other reasons.

| username: 末0_0想 | Original post link

Please take a look.

Starting component `ctl`: /home/tidb/.tiup/components/ctl/v6.5.0/ctl pd -u http://10.18.104.156:2379 -i
» scheduler show
[
  "balance-hot-region-scheduler",
  "balance-leader-scheduler",
  "balance-region-scheduler",
  "split-bucket-scheduler"
]

» 

This is the startup log of my restarted TiKV.
tikv.log (367.3 KB)

| username: 末0_0想 | Original post link

Bump.

| username: 裤衩儿飞上天 | Original post link

The region_score of your three TiKV nodes varies too much, especially 10.18.104.163, which is significantly higher than the other two nodes. The leader_score is still 0.

Check what operations you have recently performed on this node.

| username: TiDBer_jYQINSnf | Original post link

Indeed, this score is too high. I haven’t studied how the score is calculated, so I can’t give any suggestions for now.

| username: 末0_0想 | Original post link

I just migrated the database directory and didn’t perform any other operations. Is there any way to troubleshoot this?

| username: xfworld | Original post link

Back up the data and reinstall it…

| username: 裤衩儿飞上天 | Original post link

  1. I don’t know what exactly happened during your directory migration process, the information is quite limited.

  2. If you are sure there was no leader eviction, you can check if there are any anomalies with the data disk on 163.

  3. If it really doesn’t work, just add a new node and then take down 63; if that still doesn’t work, back up the data and reinstall.

    :smiling_imp::smiling_imp::smiling_imp::smiling_imp::smiling_imp::smiling_imp::smiling_imp::smiling_imp::smiling_imp::smiling_imp::smiling_imp::smiling_imp::smiling_imp:

| username: 末0_0想 | Original post link

Dear experts, may I ask how to troubleshoot the monitoring here?

| username: 裤衩儿飞上天 | Original post link

Try restarting the monitoring services. Restart Grafana, Prometheus, and Alertmanager to see if it helps.

| username: 末0_0想 | Original post link

Restarted, but it still doesn’t work.

| username: 裤衩儿飞上天 | Original post link

Check the logs of the corresponding node

monitored:
node_exporter_port: 9100
blackbox_exporter_port: 9115
deploy_dir: /home/tidb/tidb-deploy/monitored
data_dir: /home/tidb/tidb-data/monitored
log_dir: /home/tidb/tidb-deploy/monitored/log