Note:
This topic has been translated from a Chinese forum by GPT and might contain errors.Original topic: Tikv region size突然上涨,居高不下
[TiDB Usage Environment] Production Environment
[TiDB Version] 5.4.0
[Encountered Problem] TiKV approximate region size is more than 1GB continuous alert
[Reproduction Path] Not yet
[Problem Phenomenon and Impact]
Phenomenon: Continuous alert, the data on the [approximate region size] panel in Grafana keeps rising
Impact: None for now
Cluster Purpose: [Juicefs Metadata Service]
This alert has been ongoing for more than a day, the region size is growing particularly fast, the current cluster mainly consists of TiKV components, and a TiDB is deployed for GC, which is currently working normally.
Apart from this alert, there are no other anomalies in the cluster.
[Attachments]
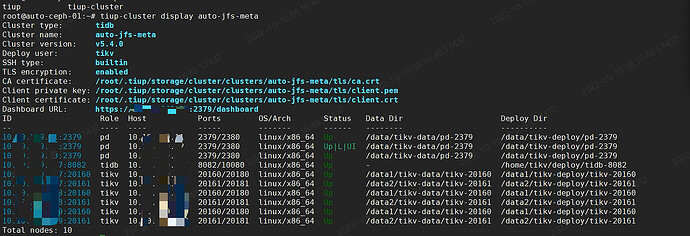
Tiup cluster Display information:
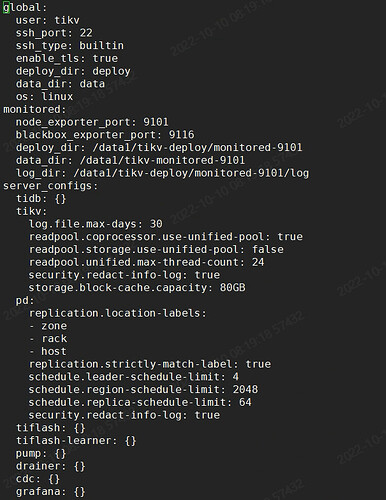
Tiup Cluster Edit Config information:
[approximate region size] panel monitoring:
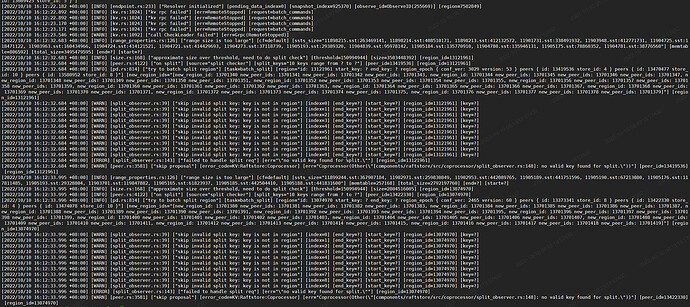
TiKV part of the logs:
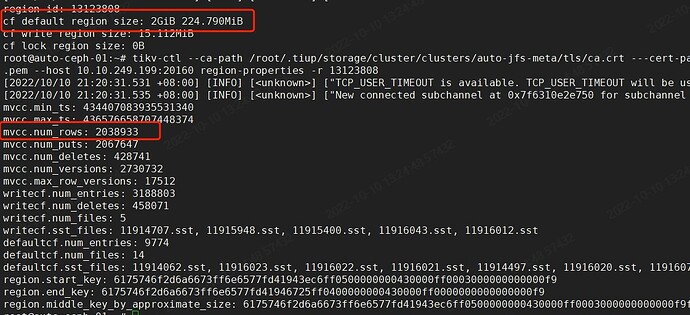
Information of one of the regions:
CF default is very large, and mvcc num_rows is particularly high
GC configuration is as follows:
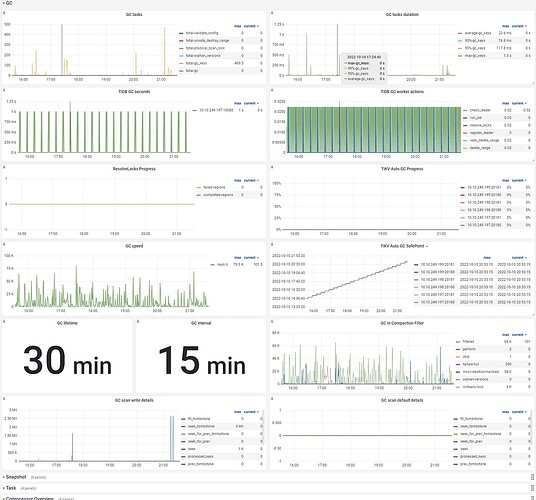
TiKV GC panel
Please provide the version information of each component, such as cdc/tikv, which can be obtained by executing cdc version/tikv-server --version.
