Note:
This topic has been translated from a Chinese forum by GPT and might contain errors.
Original topic: tidb-server oom问题排查
Version: v5.4.3
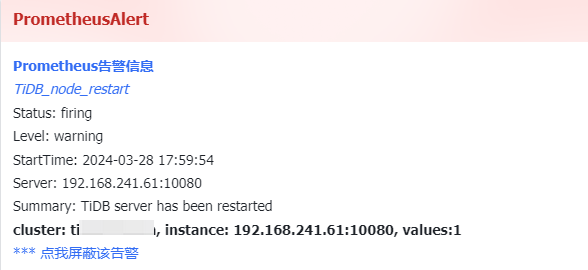
Issue: Recently, I have been receiving the TIDB_node_restart alert frequently. Upon checking the monitoring, it appears that high memory usage is the cause. Due to the diverse and extensive usage by various business operations, I want to pinpoint the specific problematic SQL. How can I locate it?
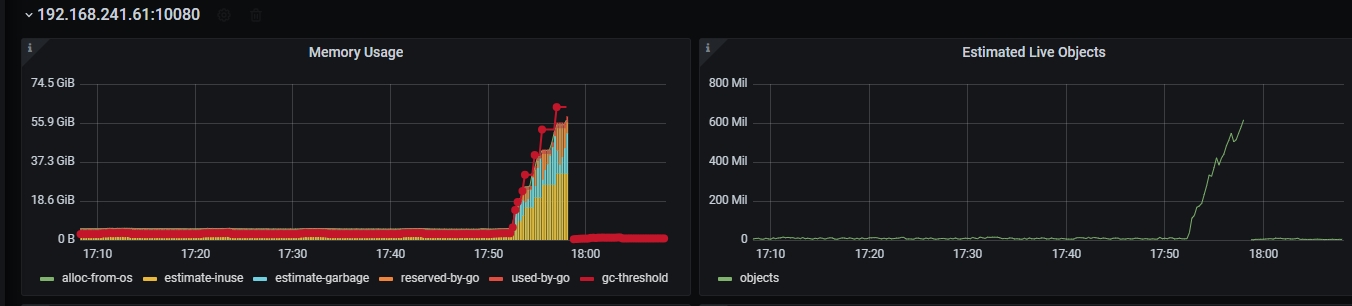
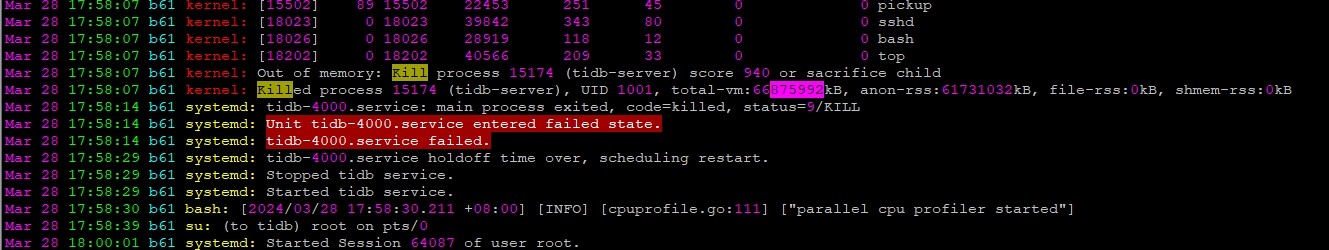
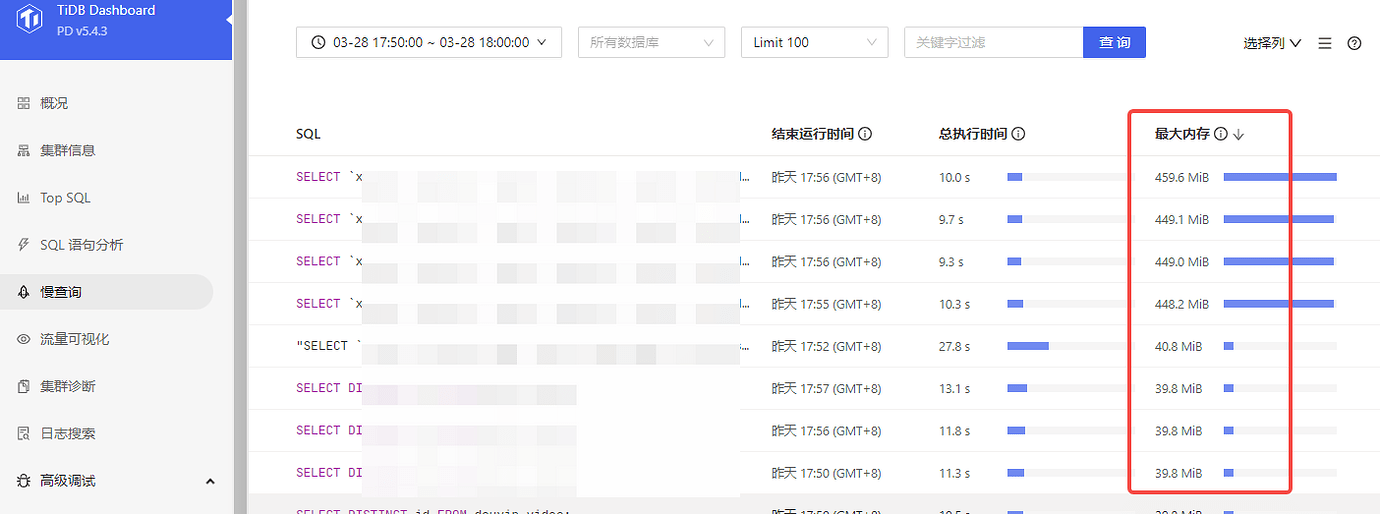
Here are some screenshots of the issue:
I have tried searching for slow query SQL on the Dashboard, but it seems I couldn’t find any SQL that consumes such a large amount of memory. I wonder if it’s because the SQL hasn’t completed execution, so the logs haven’t recorded it. How can I specifically locate it?
You have already located it, it’s these SQLs.
When checking TiDB logs, there will be expensive SQL statements.
Scold the person who wrote the SQL. Then lock them in a small dark room. Deploy their group’s application separately in a TiDB server frontend component. Upgrade their dedicated line. If any TiDB instance crashes, their own business will be unavailable without affecting others.
Please share the execution plan for the first SQL statement you mentioned above.
It’s only 4 entries totaling over 400MB, it shouldn’t be an issue. Our cluster used to have just 16GB*3 of memory, and at night, the statistics application often handled multiple entries with a maximum of 1GB without any problems. Could it be due to some other reason?
Look at my monitoring data. When I encountered an OOM, the memory usage reached over 60GB, but in the dashboard, it only shows a few hundred MB. It doesn’t match up.
First optimize the top 10 SQL queries and then observe the results. Often, it is not a single SQL query causing the issue.
Conduct a performance analysis when there are machine issues. Analyze the flame graph and combine it with slow SQL to identify the specific reasons.
Generally, we look at the expensive logs in the TiDB logs.
The slow log is recorded when the SQL execution ends. When an OOM occurs, the process is directly killed, so it is indeed possible that it is not recorded. For the logs that are recorded, you can first check why there is excessive memory usage. Then, use the log search function on the Dashboard to search the logs of the TiDB server by using the keyword “expensive” to find some SQL statements.
Directly set up monitoring to check for the keyword “expensive” in the logs, but some might not be captured.
Optimize it yourself based on the dashboard.