In TiKV, common OOM issues are mainly triggered by the following reasons:
- Block cache configuration errors or multiple TiKVs deployed on the same server without modifying the Block cache configuration.
- A slow or stuck Raftstore Apply process causing a large number of requests to pile up in the channel.
- Excessive data volume during Coprocessor aggregation.
- Network issues causing Coprocessor response pile-up.
- Memory leaks in coroutines when nodes are stuck.
- Excessive logs needing Apply causing OOM.
Troubleshooting Ideas
Issue 1: Block cache configuration errors
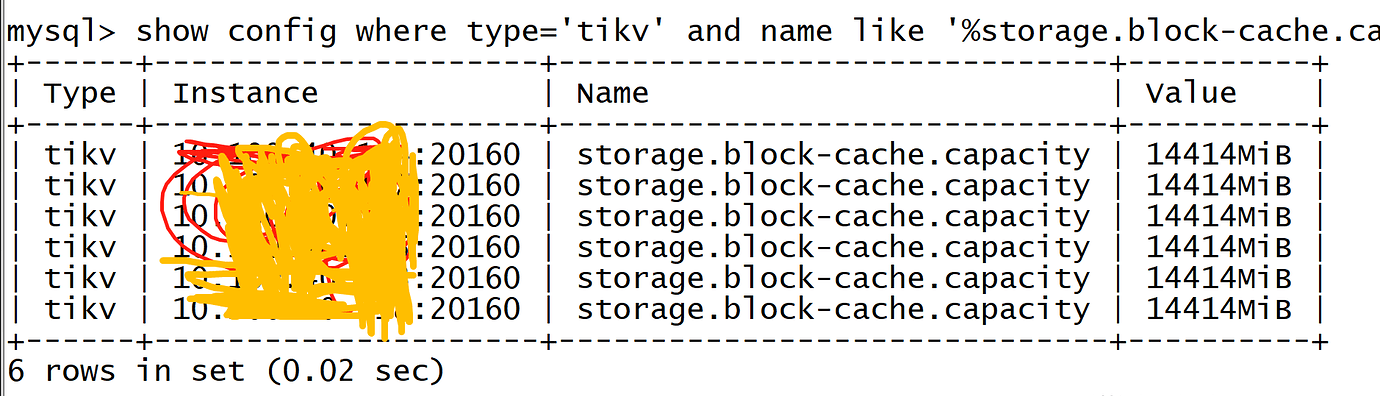
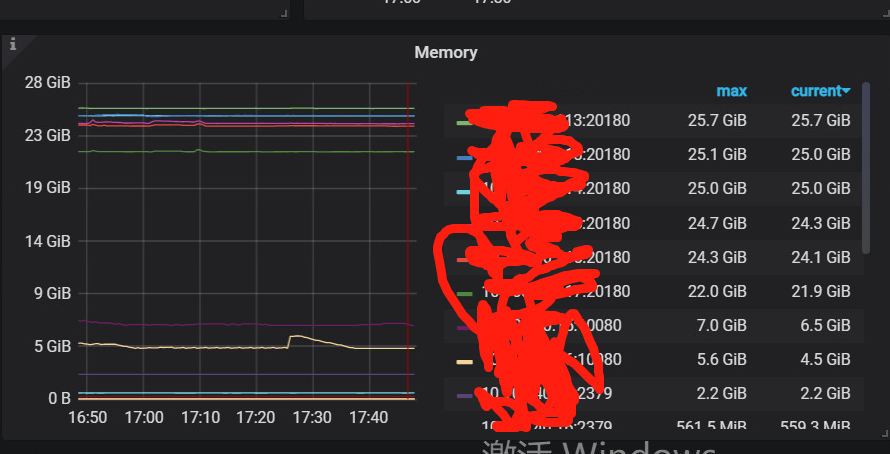
Principle By default, TiKV’s Block cache occupies 45% of the server’s memory. Configuration errors or multiple TiKVs on a single node may cause OOM due to an oversized Block cache.
Diagnosis and Handling Check the Block cache size configuration on each node. The total Block cache of all TiKVs on a single node should not exceed 45% of the total memory.
Issue 2: Raftstore Apply speed not keeping up with Raft Log reception speed
Principle Committed raft logs are processed by the store thread through an unbounded channel. If Apply is stuck (possibly due to write stall issues), the channel may occupy a large amount of memory.
Diagnosis and Handling First, check for write stalls through the TiKV-Details → Rocksdb-KV → Stall reasons monitoring by instance:
- If there is a write stall, adjust the relevant RocksDB parameters based on the stall reasons in the monitoring.
- If there is no write stall, consider increasing the number of apply threads to speed up the consumption of Raft Logs.
Issue 3: OOM caused by large coprocessor responses
Principle TiKV’s internal gRPC cache has no size limit. Some coprocessor requests with large data volumes (such as table scans) may occupy a large amount of memory due to large results.
Diagnosis and Handling This is usually caused by large regions or large intermediate results of aggregation queries:
- A quick fix is to find and kill the queries with large data reads and long processing times through the coprocessor slow-query logs (keyword slow-query) on TiKV.
- Observe if there are large regions through TiKV-Details → Server → Approximate Region size or pd’s region information, pause the queries on them, and use pd-ctl to forcibly split the large regions.
- Adjust the TiKV server.grpc-memory-pool-quota parameter to limit the total memory used by gRPC (exceeding this limit will cause some network connections to be forcibly interrupted).
Issue 4: Network issues or gRPC threads being fully occupied causing Coprocessor response pile-up
Principle TiKV’s internal gRPC cache has no size limit. If the generation speed exceeds the sending speed, or network issues cause packet pile-up, it can lead to OOM.
Diagnosis and Handling
- Check if TiKV gRPC threads are bottlenecked and consider increasing the number of gRPC threads.
- Use Node Exporter monitoring or other indicators to check for network issues. If present, consider evicting the Leader from the affected TiKV.
- Adjust the TiKV server.grpc-memory-pool-quota parameter to limit the total memory used by gRPC (exceeding this limit will cause some network connections to be forcibly interrupted).
Issue 5: Coroutine leaks causing OOM
Principle If TiKV is stuck due to hardware failure or kernel bugs but the network service is still normal, coroutines may pile up, leading to OOM.
Diagnosis and Handling This issue is very rare and difficult to diagnose with existing monitoring. It only affects versions v5.1.0, v5.1.1, v5.2.0, v5.2.1 and has been fixed in v5.1.2 & v5.2.2.
Issue 6: Excessive logs needing Apply causing OOM
Principle If TiKV Apply speed is too slow or a restart causes a large number of logs needing Apply to pile up, Log Entry will occupy a large amount of Entry Cache resources.
Diagnosis and Handling Versions before v5.2 cannot determine the root cause from existing monitoring information. Version v5.2 adds monitoring indicators for Entry Cache usage, which can be checked through TiKV-Details->Server->Memory trace to confirm if the Entry Cache size is too high.
You can troubleshoot according to the above ideas.