Note:
This topic has been translated from a Chinese forum by GPT and might contain errors.
Original topic: cluster_slow_query查不出数据
To improve efficiency, please provide the following information for a clearer problem description to get a quicker resolution:
【TiDB Usage Environment】
【Overview】 Scenario + Problem Overview
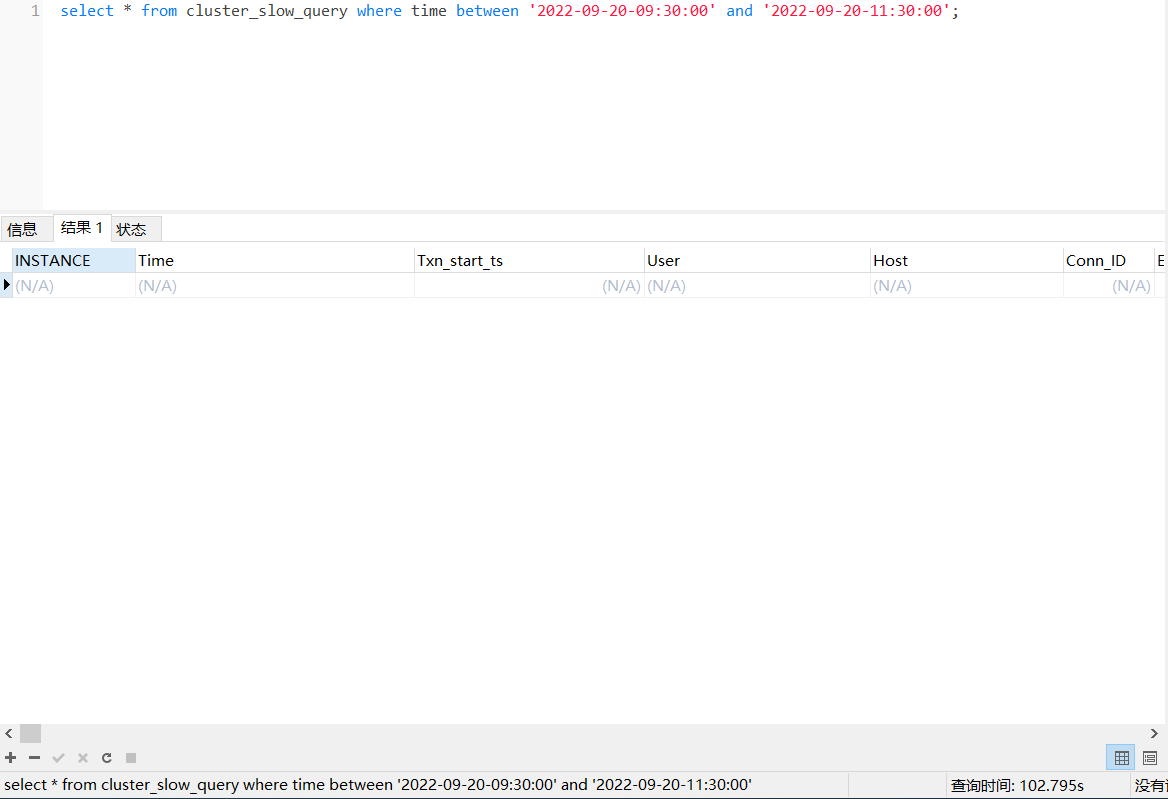
Running select * from cluster_slow_query where time between '2022-09-20-09:30:00' and '2022-09-20-11:30:00'; does not return any data,
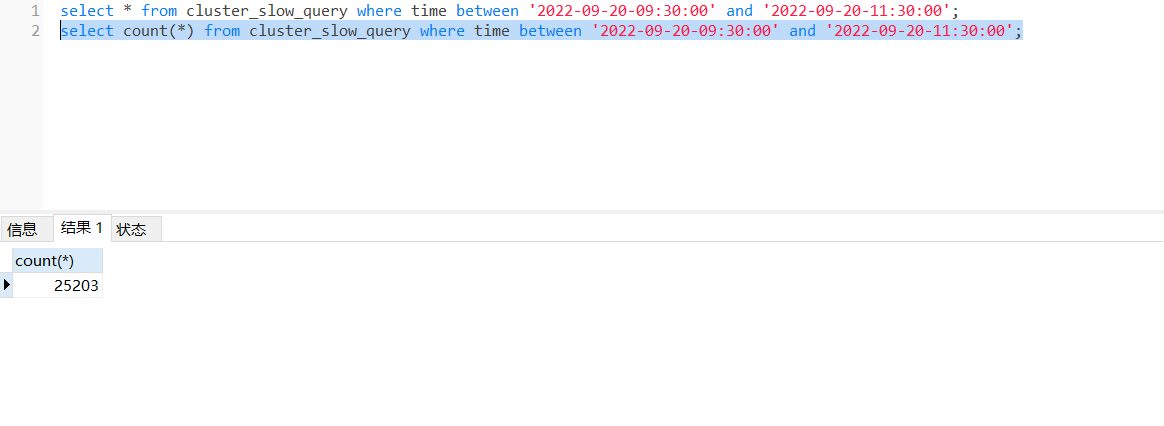
but running select count(*) from cluster_slow_query where time between '2022-09-20-09:30:00' and '2022-09-20-11:30:00'; returns data.
Am I doing something wrong?
【Phenomenon】 Business and Database Phenomenon
【TiDB Version】
V5.4.0
What account are you using, and does it have process permissions?
Is the time format incorrect?
The format ‘2022-09-20 11:30:00’
I don’t think it has anything to do with the time format.
Using the administrator account
Can I view the added conditions?
Isn’t time just a column condition? Adding the user condition doesn’t work either.
If you replace the asterisk with specific columns, it works, but if you replace it with all columns, it still doesn’t work.
What I mean is to query like “select column_name”. In that case, your account might not have column permissions for some specific columns, right?
However, when I execute select * from cluster_slow_query limit 1;, there are results. 
Can the slow queries on the dashboard provide information?
I also feel it’s a permissions issue; a similar problem occurred before.
This topic was automatically closed 60 days after the last reply. New replies are no longer allowed.

