Note:
This topic has been translated from a Chinese forum by GPT and might contain errors.
Original topic: TIDB模块机器内存使用不均匀
【TiDB Usage Environment】Production Environment
【TiDB Version】v5.2.1
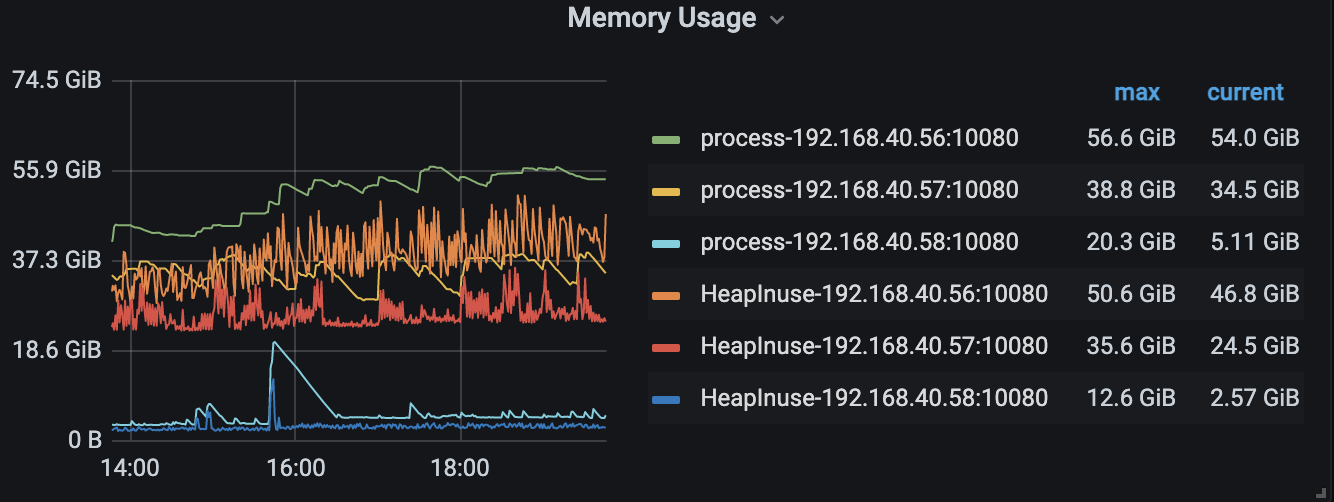
【Encountered Problem】The memory usage of TiDB machines is very uneven, almost always maintaining several times the difference. Last night, one machine’s memory suddenly spiked, causing an OOM restart.
【Reproduction Path】Daily usage
【Problem Phenomenon and Impact】
The topology of the cluster is like this, and it is normal for different types of nodes to have different memory consumption.
Currently, due to limited machine resources, TiDB, TiKV, and PD are all deployed on three identical nodes, with each module having three instances. The machines have 256GB of memory and 48 CPU cores.
Each time a single machine restarts, the other two machines experience a spike in usage that doesn’t go down, while the restarted machine remains in a state of low memory consumption.
You can check if the leaders are balanced. Additionally, deploying TiDB server and TiKV together is more likely to cause OOM (Out of Memory) issues.
What load balancing strategy is used in front of the TiDB server? What kind of distribution strategy is used?
Since it is a mixed deployment, first use the top command to check the process usage and determine which part of the memory is unbalanced.
Using HaProxy with the default distribution strategy.
Currently, there doesn’t seem to be any issues based on the monitor.
This issue has been resolved. The specific problem was due to a memory leak after TiDB GC failed, causing the memory to only increase and not decrease. Since TiDB and TiKV were deployed on the same node, the system killed TiKV when it killed the application. After TiKV restarted, TiDB was killed again due to insufficient memory. Finally, by investigating the GC anomalies (mainly errors concentrated on analyze taking too long), we adjusted the tidb_gc_life_time parameter. The remaining issue was: the field was too short, causing collection failure (统计信息收集报错 Data too long for column 'upper_bound' - TiDB 的问答社区).
This topic was automatically closed 1 minute after the last reply. No new replies are allowed.