Note:
This topic has been translated from a Chinese forum by GPT and might contain errors.Original topic: TiDB Server 流量分布不均衡
[TiDB Usage Environment]
- Production
[TiDB Version]
- v5.1.4
[Encountered Issues]
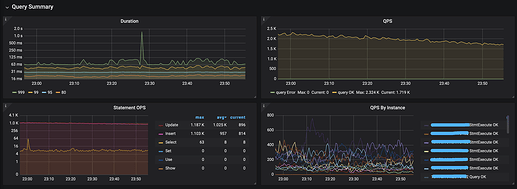
- Cluster topology: 3 physical machines with 6 TiDB Server instances (TiKV and Prometheus are on other physical machines, not on these three). Load balancing is done using HaProxy, but the traffic is uneven.
- Below are some monitoring snapshots of the TiDB Server, showing CPU usage and connection count:
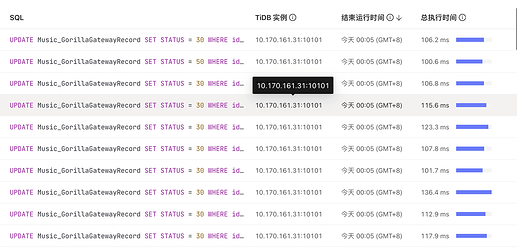
- From the Dashboard, it can be seen that almost all slow queries are concentrated on one or two instances:
- The related UPDATE statement is as follows, with
idas the primary key and each SQL value being different:
## create table
CREATE TABLE `Music_GorillaGatewayRecord` (
  `id` bigint(20) NOT NULL COMMENT '',
  `processType` varchar(32) NOT NULL COMMENT '',
  `appName` varchar(64) NOT NULL COMMENT '',
  `sdkVersion` varchar(32) NOT NULL COMMENT '',
  `businessType` varchar(32) NOT NULL COMMENT '',
  `ip` varchar(64) DEFAULT NULL COMMENT '',
  `status` int(4) NOT NULL COMMENT '',
  `result` text DEFAULT NULL COMMENT '',
  `callback` text DEFAULT NULL COMMENT '',
  `batch` tinyint(2) NOT NULL DEFAULT '0' COMMENT '',
  `count` int(4) NOT NULL DEFAULT '1' COMMENT '',
  `retry` int(4) NOT NULL DEFAULT '0' COMMENT '',
  `callback_Encrypt2013` longtext DEFAULT NULL COMMENT '',
  `createTime` datetime NOT NULL DEFAULT CURRENT_TIMESTAMP COMMENT 'Creation Time',
  `updateTime` datetime NOT NULL DEFAULT CURRENT_TIMESTAMP ON UPDATE CURRENT_TIMESTAMP COMMENT 'Update Time',
  PRIMARY KEY (`id`,`createTime`) /*T![clustered_index] NONCLUSTERED */,
  KEY `idx_appName_bType_status` (`appName`,`businessType`,`status`)
) ENGINE=InnoDB DEFAULT CHARSET=utf8mb4 COLLATE=utf8mb4_bin/*!90000 SHARD_ROW_ID_BITS=5 */ COMMENT=''
PARTITION BY RANGE ( TO_DAYS(`createTime`) ) (
  PARTITION `p20220701` VALUES LESS THAN (738702),
  PARTITION `p20220801` VALUES LESS THAN (738733),
  PARTITION `p20220901` VALUES LESS THAN (738764),
  PARTITION `p20221001` VALUES LESS THAN (738794),
  PARTITION `p20221101` VALUES LESS THAN (738825),
  PARTITION `p20221201` VALUES LESS THAN (738855),
  PARTITION `p20230101` VALUES LESS THAN (738886),
  PARTITION `p20230201` VALUES LESS THAN (738917),
  PARTITION `p20230301` VALUES LESS THAN (738945)
)

## Operation SQL statement
UPDATE Music_GorillaGatewayRecord SET status = 30 WHERE id = 385804593597091847 AND status < 30 LIMIT 1;
Finally, dear community experts, what optimization methods can be used in this situation? Any help would be greatly appreciated.


