Note:
This topic has been translated from a Chinese forum by GPT and might contain errors.
Original topic: Unified Read Pool CPU一直打满
[TiDB Usage Environment] Production Environment / Testing / PoC
[TiDB Version] V5.4.0
[Encountered Issues]
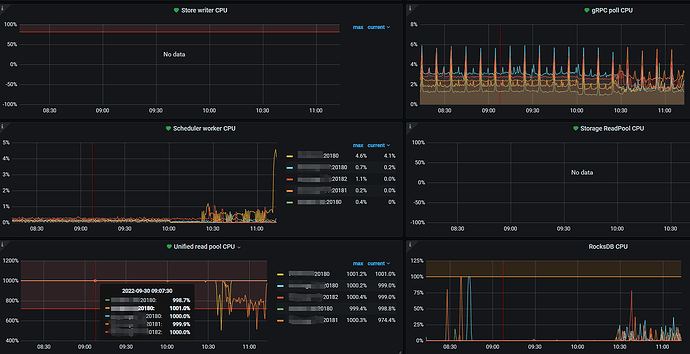
- Unified Read Pool CPU is set to 10, and the CPU usage of the 5 TiKV nodes is almost always at 1000%.
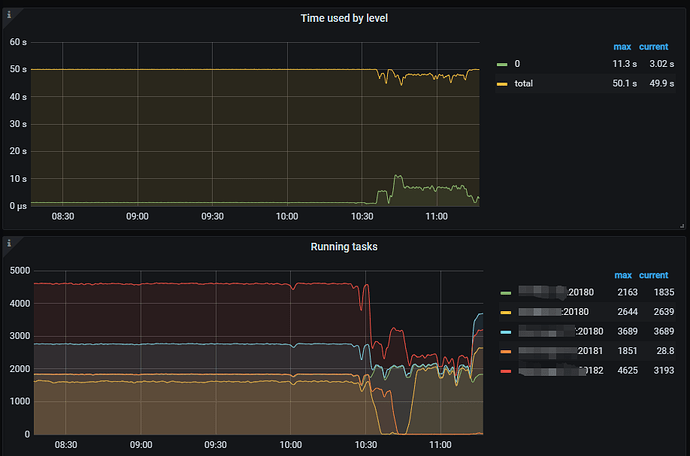
- The number of running tasks on each node can reach over 2000 at peak times. I wanted to try setting the tidb_enable_paging parameter to ON, but the parameter show variables like ‘%tidb_enable_paging%’; did not return any results.
[Reproduction Path] Steps taken that led to the issue
[Issue Phenomenon and Impact]
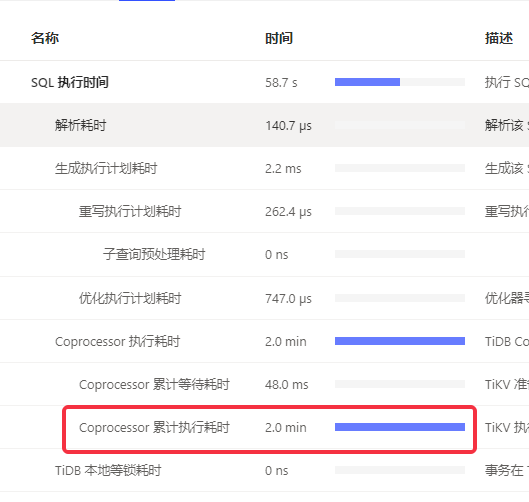
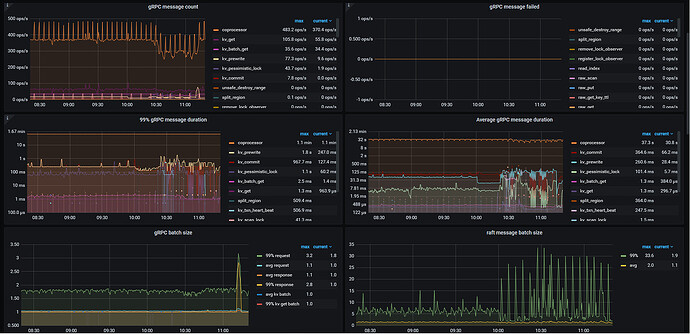
- The entire database queries have slowed down, with most queries having long cumulative execution times in the Coprocessor.
- Unable to set tidb_enable_paging
[Attachments]
Please provide the version information of each component, such as cdc/tikv, which can be obtained by executing cdc version/tikv-server --version.
You can increase the max-thread-count, your data scanning is too intensive.
I don’t think this is right. It shouldn’t always be fully utilized. The pressure is actually okay. Even if the coprocessor pool is separately changed to 12, it still gets fully utilized at 12.
Please provide detailed TiKV monitoring data using PingCAP MetricsTool.
Sorry, I still don’t dare to export the data. 
The Unified read pool is another thread pool in TiKV. By default, its size (readpool.unified.max-thread-count) is 80% of the machine’s CPU count. It is a combination of the Coprocessor thread pool and the Storage Read Pool. All read requests, including kv get, kv batch get, raw kv get, coprocessor, etc., will be executed in this thread pool. The Unified read pool CPU represents the CPU usage of the Unified read pool threads, which usually indicates the read load.
Are there many slow SQL queries? Do they affect the business?
The query speed has now returned to normal, and there are no slow SQL queries. It seems that the slowdown occurs continuously overnight. We have now separated the read pool and set the Coprocessor thread pool to 12, but it is still fully utilized. In comparison, other clusters occasionally reach 25%, but this one is consistently at 1200%.
Because the coprocessor pool was changed to 12, all TiKV nodes were restarted and recovered.
The CPU is fully utilized. Would it be better if we disable the unify-read-pool?


