Note:
This topic has been translated from a Chinese forum by GPT and might contain errors.
Original topic: update 显示执行时间为50S
[TiDB Usage Environment] Production Environment / Testing / PoC
[TiDB Version]
[Reproduction Path] What operations were performed that led to the issue
[Encountered Issue: Problem Phenomenon and Impact]
[Resource Configuration]
[Attachments: Screenshots/Logs/Monitoring]
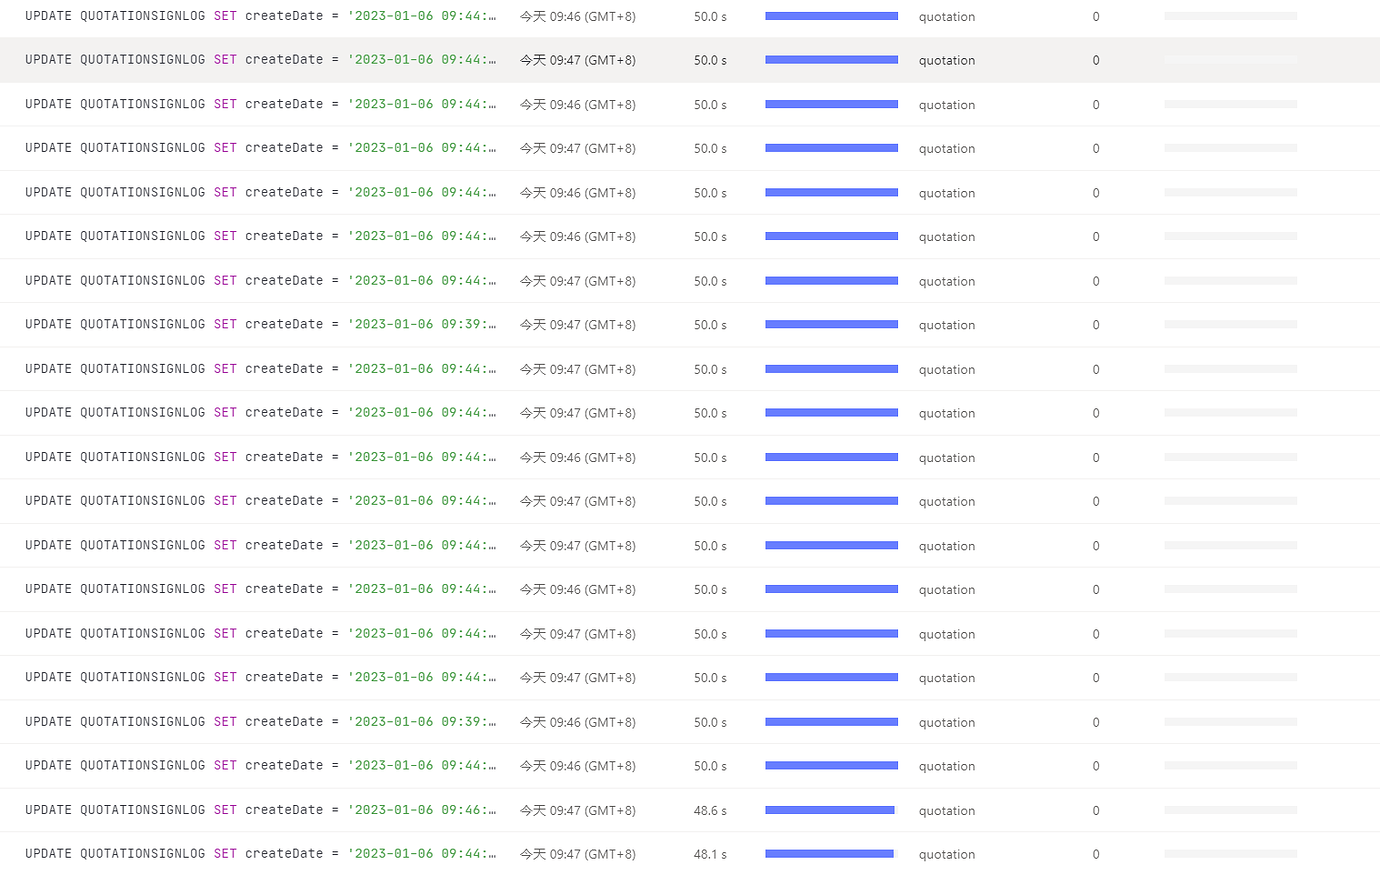
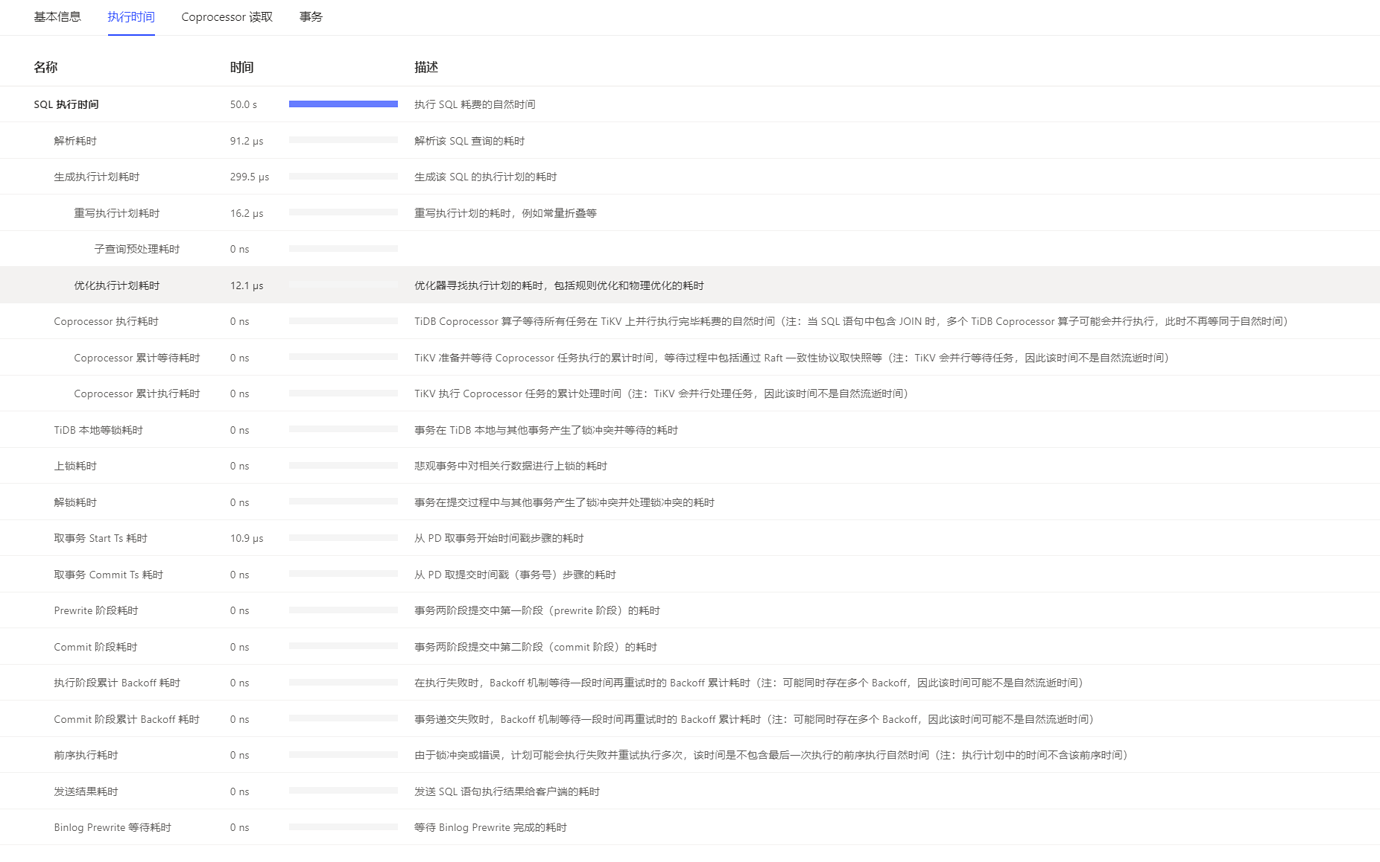
Upon checking the slow queries, it was found that there are many updates taking 50 seconds to execute, and some updates with relatively shorter execution times. Upon checking the execution times separately, it was found that the SQLs taking 50 seconds to execute did not show any lock conflict information.
These types of updates are based on the primary key, and if the primary key is updated, it should normally be very fast.
Okay, that rules out the possibility that the execution plan is incorrect, causing the slowness.
Next, let’s check if there are any resource bottlenecks or unreasonable parameters in the locks and cluster that are preventing optimal resource utilization.
The overall resource usage of the cluster is not much different from before. I don’t know why this update is taking so long to execute.
Then let’s check the lock situation. See if the official documentation posted above is helpful.
Conflicts occur not only when updating the same data, right? But looking at those 50s SQLs, the updated values of the primary keys are all different.
Check if this article is helpful to you~
I think it’s still a locking issue. I suggest checking the logs again.
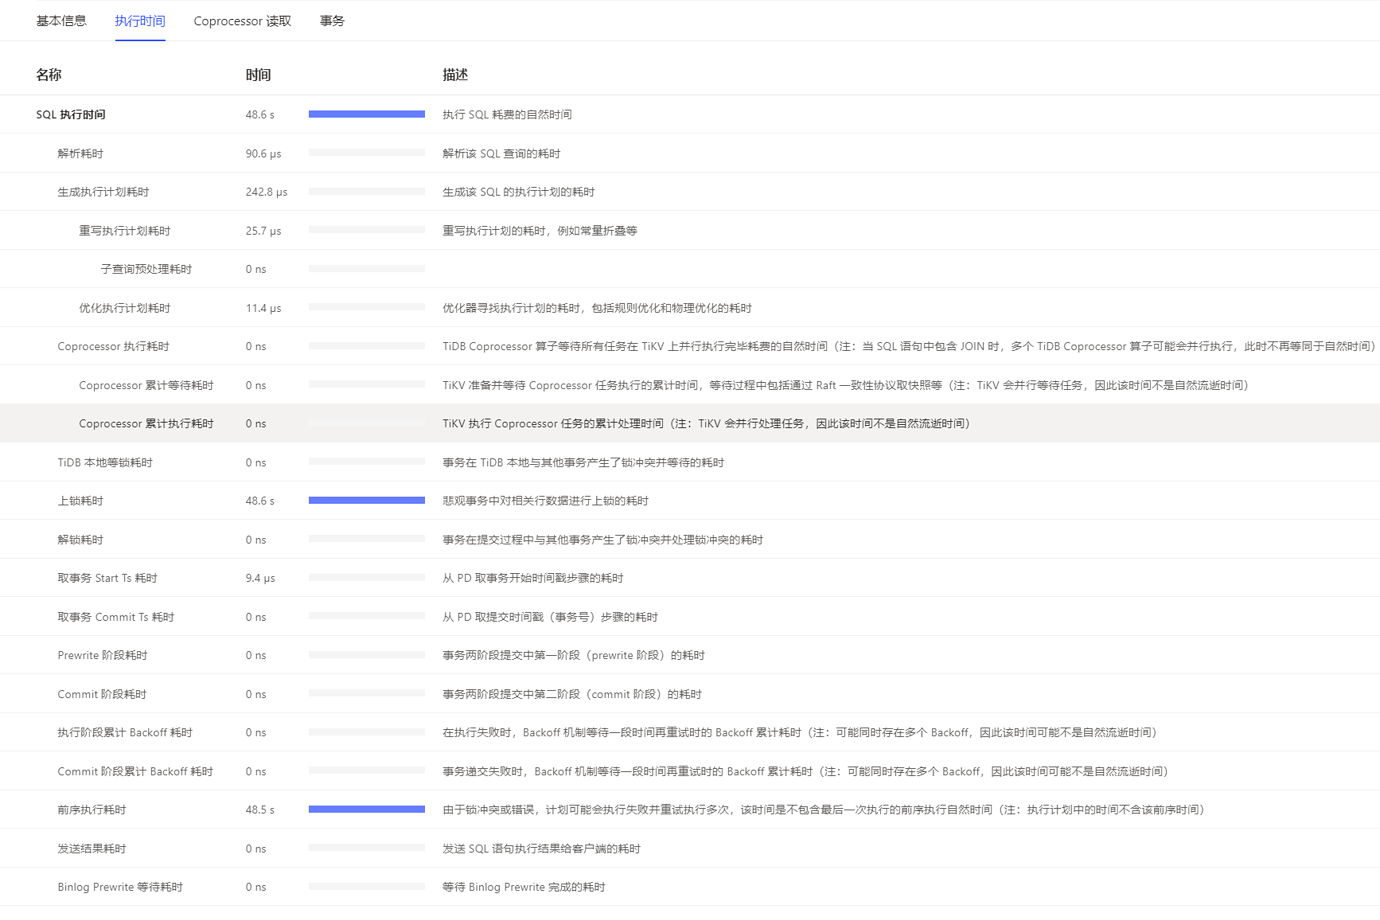
The logs mainly focus on what content? I looked at the execution time of two SQL statements, some have lock time and some don’t. Does the lock duration mean it has never been released?
Has this investigation been completed? Any progress?
The time is all spent on locking. It must be due to multithreading and concurrent modifications of the same data. You need to develop and modify the program logic to avoid simultaneous modifications.
The application side reported that there were multiple modifications to the same record, causing the subsequent script waiting time to become increasingly longer.
Have you already optimized the business logic of the application?
The application side said to check it out.