Note:
This topic has been translated from a Chinese forum by GPT and might contain errors.Original topic: update 更新变慢,where条件是主键+其他
[TiDB Usage Environment]
Production environment, version v5.1.4
[Overview] Scenario + Problem Overview
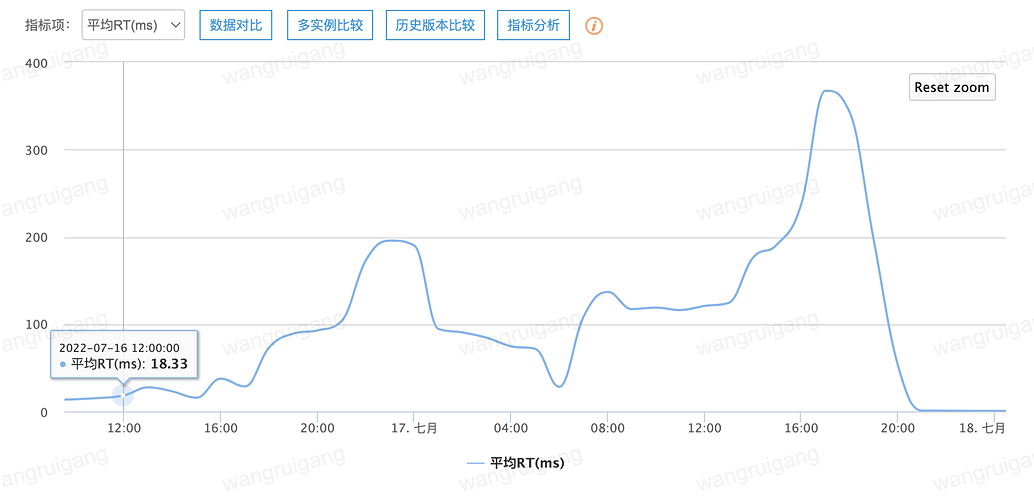
- Dual write on the business side, the time point is July 11, and the average client RT is 15ms.
- On the evening of July 16 at 20:00, the average client RT started to soar, peaking at 340ms, consumption slowed down and backlog occurred.
- From the client’s perspective, all clients slowed down, but there was no change in TiDB QPS on the server side.
[Background] Operations performed
- None
[Phenomenon] Business and database phenomena
-
The table is a
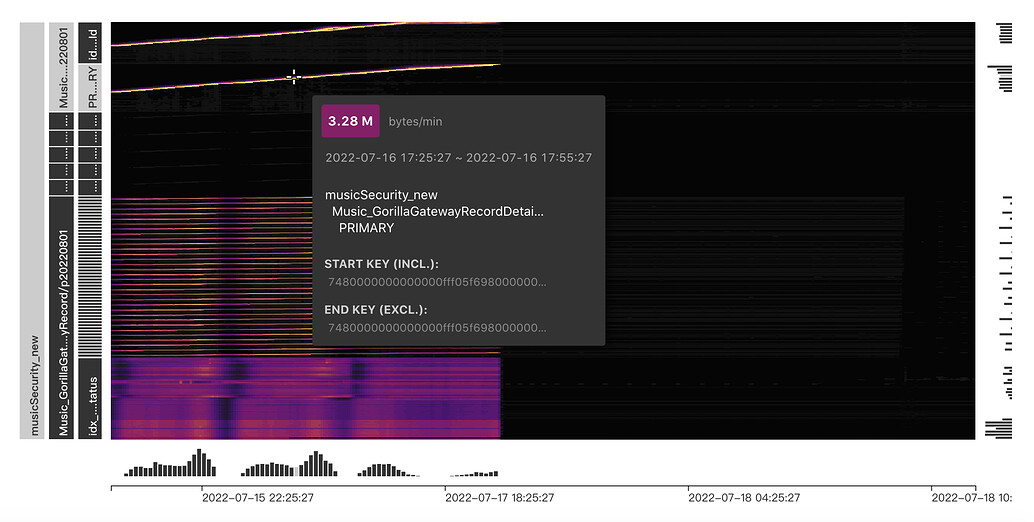
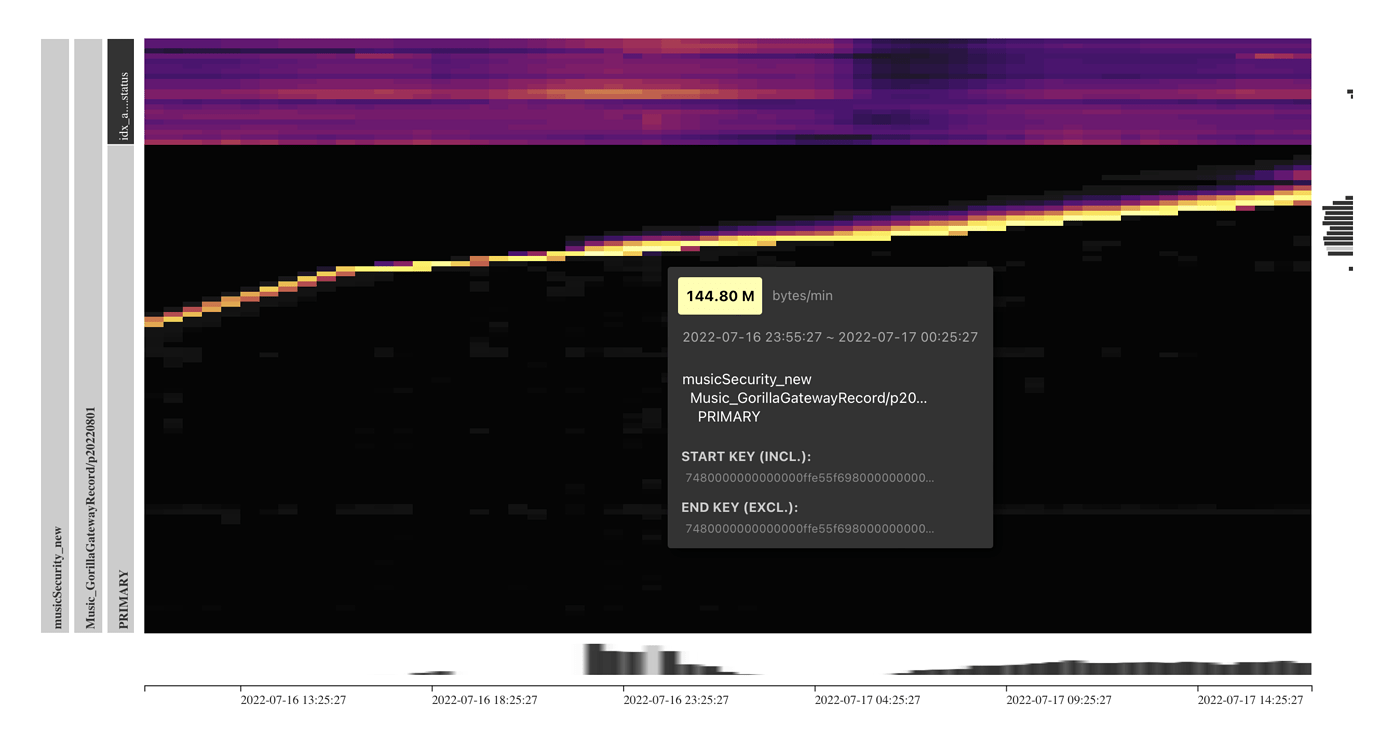
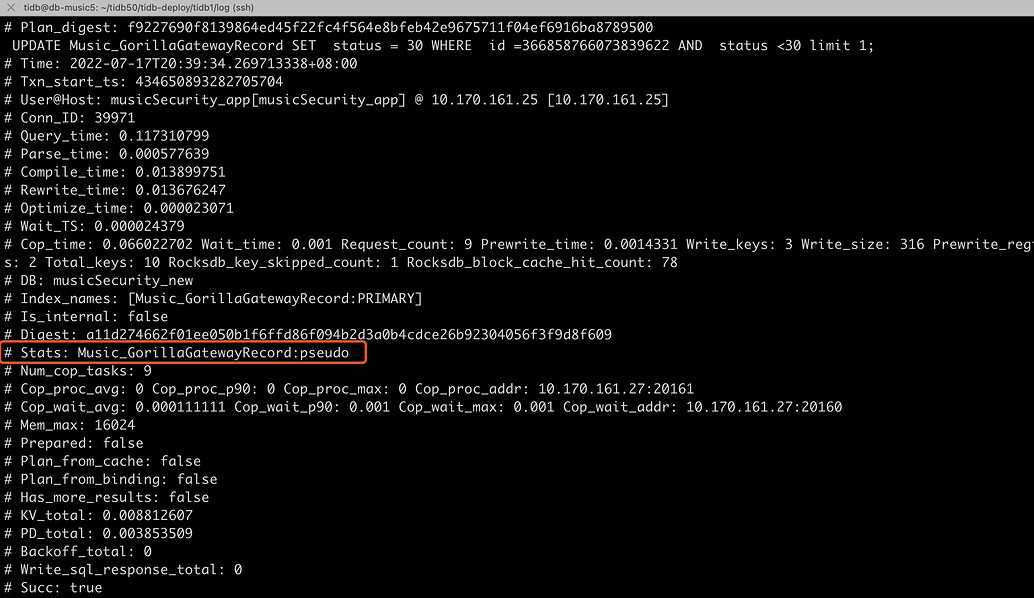
rangepartition,idisauto_increment, it is a non-clustered index table, usingSHARD_ROW_ID_BITSto scatterrowid, the table structure is as follows (other tables):CREATE TABLE `Music_GorillaGatewayRecord` ( `id` bigint(20) NOT NULL AUTO_INCREMENT COMMENT 'Primary key id', `processType` varchar(32) NOT NULL COMMENT '', `appName` varchar(64) NOT NULL COMMENT '', `sdkVersion` varchar(32) NOT NULL COMMENT '', `businessType` varchar(32) NOT NULL COMMENT '', `ip` varchar(64) DEFAULT NULL COMMENT '', `status` int(4) NOT NULL COMMENT '', `result` text DEFAULT NULL COMMENT '', `callback` text DEFAULT NULL COMMENT '', `batch` tinyint(2) NOT NULL DEFAULT '0' COMMENT '', `count` int(4) NOT NULL DEFAULT '1' COMMENT '', `retry` int(4) NOT NULL DEFAULT '0' COMMENT '', `callback_Encrypt2013` longtext DEFAULT NULL COMMENT '', `createTime` datetime NOT NULL DEFAULT CURRENT_TIMESTAMP COMMENT '', `updateTime` datetime NOT NULL DEFAULT CURRENT_TIMESTAMP ON UPDATE CURRENT_TIMESTAMP COMMENT '', PRIMARY KEY (`id`,`createTime`) /*T![clustered_index] NONCLUSTERED */, KEY `idx_appName_bType_status` (`appName`,`businessType`,`status`) ) ENGINE=InnoDB DEFAULT CHARSET=utf8mb4 COLLATE=utf8mb4_bin/*!90000 SHARD_ROW_ID_BITS=5 */ COMMENT='' PARTITION BY RANGE ( TO_DAYS(`createTime`) ) ( PARTITION `p20220501` VALUES LESS THAN (738641), PARTITION `p20220601` VALUES LESS THAN (738672), PARTITION `p20220701` VALUES LESS THAN (738702), PARTITION `p20220801` VALUES LESS THAN (738733), PARTITION `p20220901` VALUES LESS THAN (738764), PARTITION `p20221001` VALUES LESS THAN (738794), PARTITION `p20221101` VALUES LESS THAN (738825), PARTITION `p20221201` VALUES LESS THAN (738855), PARTITION `p20230101` VALUES LESS THAN (738886)); -
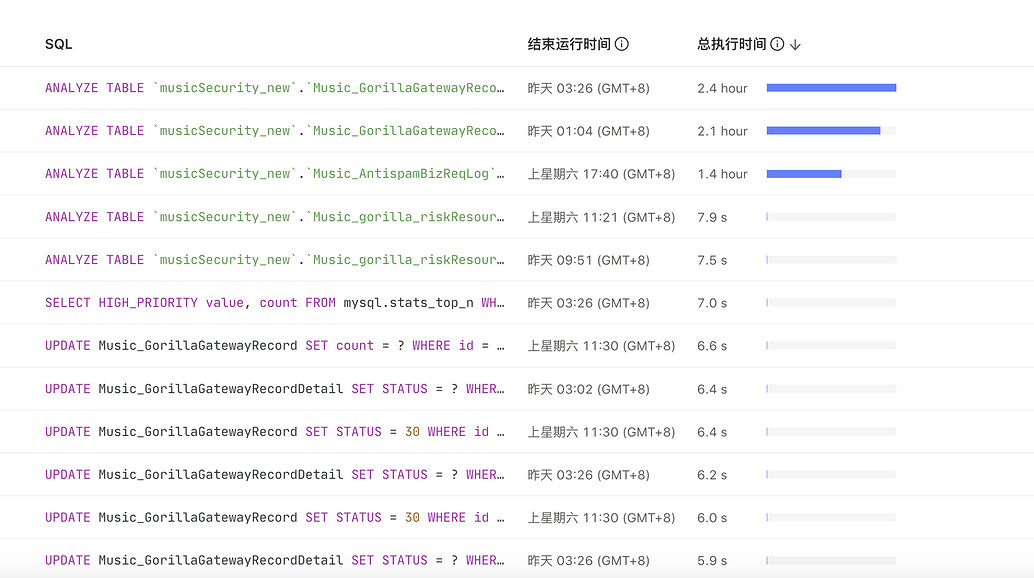
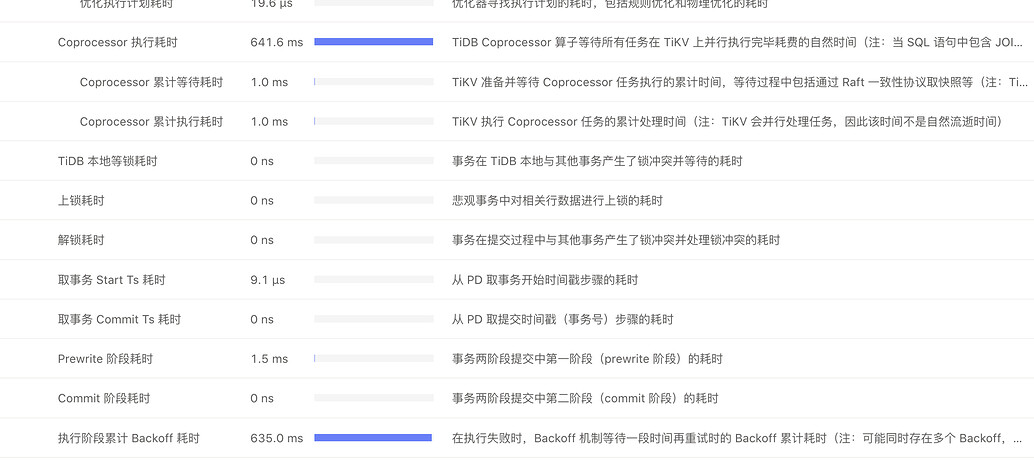
Dashboardandslowlog(100ms)
-
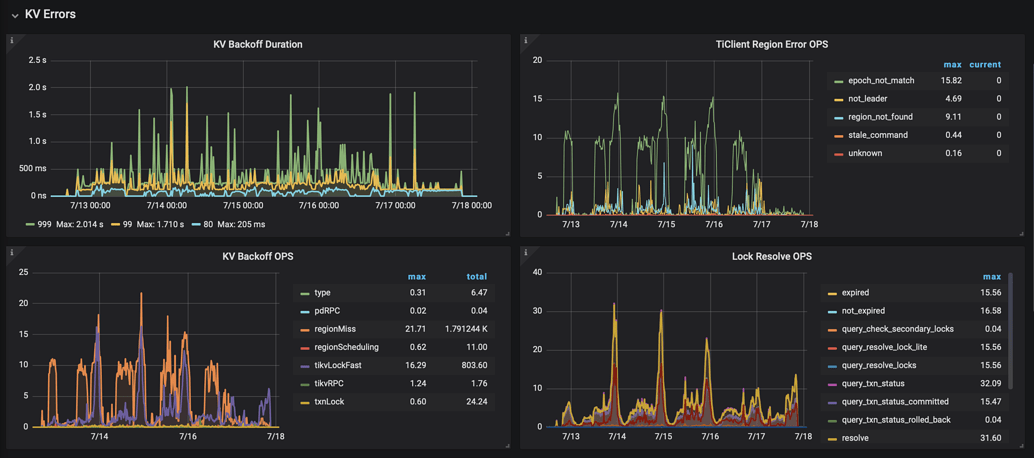
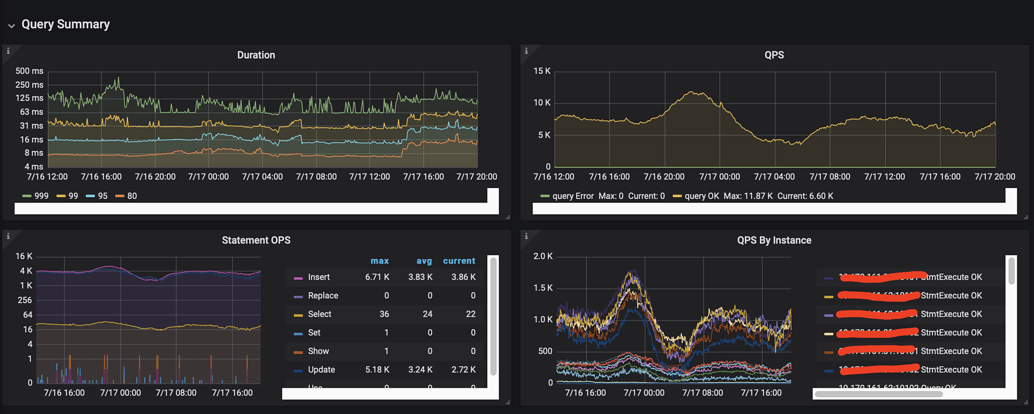
Some monitoring charts of the server and client:
TiDB Server monitoring [2022-07-16 12:00:00-2022-07-17 20:00:00]:
Client monitoring [2022-07-16 12:00:00-2022-07-17 21:00:00]:
In conclusion, I would like to ask the community experts for troubleshooting ideas.