[Urgent Help Needed] TiDB Cluster Response Slows Down After Upgrading to 6.1.3

Note:
This topic has been translated from a Chinese forum by GPT and might contain errors.

Original topic: 【紧急求助】tidb 升级到6.1.3 集群响应变慢

| username: 是我的海

[TiDB Usage Environment] Production Environment
[TiDB Version] 6.1.3
[Reproduction Path] Upgraded from 5.4.2 to 6.1.3
[Encountered Issue: Problem Phenomenon and Impact]
All business SQL responses are particularly slow

[Resource Configuration]

[Attachments: Screenshots/Logs/Monitoring]

| username: xuexiaogang | Original post link

Check if there are any locks?

| username: 裤衩儿飞上天 | Original post link

Why does that node have so few regions? It seems to be on an increasing trend, like it’s balancing.

| username: polars | Original post link

Looking at the node’s high CPU usage, check topsql through the dashboard; there should be some CPU-intensive large transactions.

| username: Lucien-卢西恩 | Original post link

  1. Check the value of the tidb_analyze_version parameter variable in Analyze.
  2. Provide the TiKV-details and PD monitoring data at https://metricstool.pingcap.net/.
| username: 田帅萌7 | Original post link

The image you provided is not accessible. Please provide the text content you need translated.

| username: Hacker_nTkchcIf | Original post link

Take a look at the PD statistics-balance monitoring?

| username: dba-kit | Original post link

By opening TopSQL through the TiDB Dashboard panel, you can see which SQL statements are consuming more CPU. Additionally, it would be best to provide more details about the cluster. From the monitoring, it appears that starting from 16:50, the number of update and insert statements increased, the duration also started to rise, and the TiKV load began to increase.

Here’s a screenshot showing how to enable TopSQL. After enabling it, select a TiKV node to display the CPU consumption at that time:

| username: army | Original post link

You can export the grafana data of tikv-detail according to the following method. The tikv CPU is a bit high, let’s see which specific part is causing it.

| username: 特雷西-迈克-格雷迪 | Original post link

It could be a related parameter issue, or the execution plan of some SQL has deviated.

| username: 是我的海 | Original post link

tikv-details monitoring
tidb-kunpeng_dms-TiKV-Details_2023-01-12T10 29 12.492Z.json (31.1 MB)

| username: army | Original post link

You can first reduce the GC life time a bit; 2 days is a bit too long. The compaction flow is getting larger, and the pending bytes are also a bit high. Additionally, you can temporarily disable auto analyze, or adjust the start and end times to UTC 00:00 +0800 and 07:00 +0800.

| username: 是我的海 | Original post link

Current status: Execution plan binding has been made for the update.

MySQL [kunpeng_dms_call]> show global bindings\G
*************************** 1. row ***************************
Original_sql: update `kunpeng_dms_call` . `tbl_device_send_cmd_log` set `device_code` = ? , `sign_no` = ? , `status` = ? where `uniq_id` = ? and `uniq_id` = ?
    Bind_sql: UPDATE `kunpeng_dms_call`.`tbl_device_send_cmd_log` USE INDEX (`PRIMARY`) SET `device_code`='ZYBSJ0037581', `sign_no`='4005', `status`=1 WHERE `uniq_id` = 'rpca5a64e9b529e4497b5198ac4abe406161673513647' AND `uniq_id` = 'rpca5a64e9b529e4497b5198ac4abe406161673513647'
  Default_db: kunpeng_dms_call
      Status: enabled
 Create_time: 2023-01-12 23:43:04.190
 Update_time: 2023-01-12 23:43:04.190
     Charset: utf8
   Collation: utf8_general_ci
      Source: manual
*************************** 2. row ***************************
Original_sql: select count ( ? ) from `kunpeng_dms_call` . `tbl_tel_call_log` where `encrypt_number` = ? and `create_time` >= ? and `call_status` in ( ... )
    Bind_sql: SELECT /*+ read_from_storage(tiflash[`tbl_tel_call_log`])*/ count(1) FROM `kunpeng_dms_call`.`tbl_tel_call_log` WHERE `encrypt_number` = '8a4f5a835373df4da2154f34cdfb4b790a4b8bc2ebf95d0c' AND `create_time` >= 1673452800 AND `call_status` IN (3,5,31)
  Default_db: kunpeng_dms_call
      Status: enabled
 Create_time: 2023-01-12 17:19:57.029
 Update_time: 2023-01-12 17:19:57.029
     Charset: utf8
   Collation: utf8_general_ci
      Source: manual

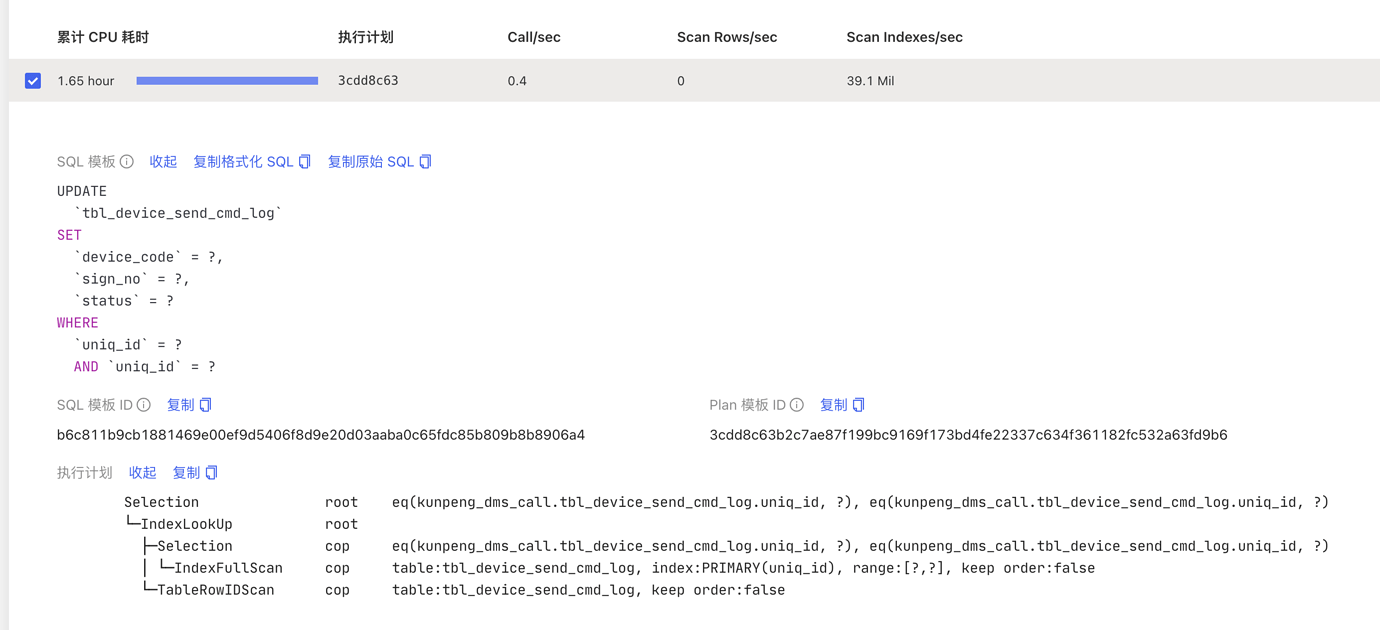
At this point, the update still has a full table scan execution plan, as shown in the slow log below:

*************************** 3. row ***************************
                     INSTANCE: 10.105.128.60:10094
                         Time: 2023-01-12 23:46:14.049842
                 Txn_start_ts: 438707998008803343
                         User: kunpengdm_app
                         Host: 10.110.0.232
                      Conn_ID: 1721487763422848565
             Exec_retry_count: 0
              Exec_retry_time: 0
                   Query_time: 173.620817781
                   Parse_time: 0
                 Compile_time: 0.000460205
                 Rewrite_time: 0.000290375
           Preproc_subqueries: 0
      Preproc_subqueries_time: 0
                Optimize_time: 0
                      Wait_TS: 0.000010595
                Prewrite_time: 0
    Wait_prewrite_binlog_time: 0
                  Commit_time: 0
           Get_commit_ts_time: 0
          Commit_backoff_time: 0
                Backoff_types: 
            Resolve_lock_time: 0
        Local_latch_wait_time: 0
                   Write_keys: 0
                   Write_size: 0
              Prewrite_region: 0
                    Txn_retry: 0
                     Cop_time: 173.250368907
                 Process_time: 2465.093
                    Wait_time: 9.785
                 Backoff_time: 0
                LockKeys_time: 0
                Request_count: 456
                   Total_keys: 478359688
                 Process_keys: 478358738
 Rocksdb_delete_skipped_count: 310
    Rocksdb_key_skipped_count: 478359522
Rocksdb_block_cache_hit_count: 518277
     Rocksdb_block_read_count: 101
      Rocksdb_block_read_byte: 5267193
                           DB: kunpeng_dms_call
                  Index_names: [tbl_device_send_cmd_log:PRIMARY]
                  Is_internal: 0
                       Digest: b6c811b9cb1881469e00ef9d5406f8d9e20d03aaba0c65fdc85b809b8b8906a4
                        Stats: tbl_device_send_cmd_log:438707801073123363
                 Cop_proc_avg: 5.405905701
                 Cop_proc_p90: 14.489
                 Cop_proc_max: 32.277
                Cop_proc_addr: 10.105.128.115:20175
                 Cop_wait_avg: 0.021458333
                 Cop_wait_p90: 0.053
                 Cop_wait_max: 0.122
                Cop_wait_addr: 10.105.128.115:20175
                      Mem_max: 7210
                     Disk_max: 0
                     KV_total: 2604.177794892
                     PD_total: 0.000009744
                Backoff_total: 0
     Write_sql_response_total: 0
                  Result_rows: 0
               Backoff_Detail: 
                     Prepared: 1
                         Succ: 0
                IsExplicitTxn: 0
            IsWriteCacheTable: 0
              Plan_from_cache: 0
            Plan_from_binding: 1
             Has_more_results: 0
                         Plan:  id                      task            estRows         operator info                                                                                                                                                                                                  actRows         execution info                                                                                                                                                                                                                                                                                                                                                                                                                                                                                                                                                                                memory         disk
        Update_4                root            0               N/A                                                                                                                                                                                                            0               time:2m53.6s, loops:1,                                                                                                                                                                                                                                                                                                                                                                                                                                                                                                                                                                        0 Bytes         N/A
        └─Selection_10          root            1.01            eq(kunpeng_dms_call.tbl_device_send_cmd_log.uniq_id, "rpc7b57f49908294744a5f1309f39aeac111673538200"), eq(kunpeng_dms_call.tbl_device_send_cmd_log.uniq_id, "rpc7b57f49908294744a5f1309f39aeac111673538200")   0               time:2m53.6s, loops:1                                                                                                                                                                                                                                                                                                                                                                                                                                                                                                                                                                         6.70 KB         N/A
          └─IndexLookUp_9       root            1.01                                                                                                                                                                                                                           0               time:2m53.6s, loops:1,                                                                                                                                                                                                                                                                                                                                                                                                                                                                                                                                                                        354 Bytes       N/A
            ├─Selection_8       cop[tikv]       1.01            eq(kunpeng_dms_call.tbl_device_send_cmd_log.uniq_id, "rpc7b57f49908294744a5f1309f39aeac111673538200"), eq(kunpeng_dms_call.tbl_device_send_cmd_log.uniq_id, "rpc7b57f49908294744a5f1309f39aeac111673538200")   0               time:2m53.6s, loops:1, cop_task: {num: 456, max: 32.3s, min: 228.5ms, avg: 5.43s, p95: 20.3s, max_proc_keys: 1305408, p95_proc_keys: 1212810, tot_proc: 41m5.1s, tot_wait: 9.79s, rpc_num: 456, rpc_time: 41m15.2s, copr_cache_hit_ratio: 0.00}, tikv_task:{proc max:973ms, min:226ms, p80:661ms, p95:744ms, iters:469212, tasks:456}, scan_detail: {total_process_keys: 478358738, total_process_keys_size: 33906243952, total_keys: 478359688, rocksdb: {delete_skipped_count: 310, key_skipped_count: 478359522, block: {cache_hit_count: 518277, read_count: 101, read_byte: 5.02 MB}}}   N/A             N/A
            │ └─IndexFullScan_6 cop[tikv]       1709241802      table:tbl_device_send_cmd_log, index:PRIMARY(uniq_id), keep order:false                                                                                                                                        478358738       tikv_task:{proc max:891ms, min:169ms, p80:568ms, p95:643ms, iters:469212, tasks:456}                                                                                                                                                                                                                                                                                                                                                                                                                                                                                                          N/A             N/A
            └─TableRowIDScan_7  cop[tikv]       1.01            table:tbl_device_send_cmd_log, keep order:false                                                                                                                                                                0                                                                                                                                                                                                                                                                                                                                                                                                                                                                                                                                                                                                             N/A             N/A
                  Plan_digest: 3cdd8c63b2c7ae87f199bc9169f173bd4fe22337c634f361182fc532a63fd9b6
                    Prev_stmt: 
                        Query: UPDATE `tbl_device_send_cmd_log` SET `device_code`=?,`sign_no`=?,`status`=? WHERE uniq_id = ? AND `uniq_id` = ? [arguments: ("ZYBSJ0129423", 4002, 1, "rpc7b57f49908294744a5f1309f39aeac111673538200", "rpc7b57f49908294744a5f1309f39aeac111673538200")];

When I manually execute the update SQL, it is very fast, and the execution plan is different from the one in the slow query. The execution speed is very fast.

MySQL [kunpeng_dms_call]> explain  UPDATE `tbl_device_send_cmd_log` SET `device_code`='ZYBSJ0086840',`sign_no`=4002,`status`=1 WHERE uniq_id = 'rpc1be6f4d4e26a4306b1bf45b5c75b65f31673537670' AND `uniq_id` = 'rpc1be6f4d4e26a4306b1bf45b5c75b65f31673537670';

+-------------------+---------+------+-------------------------------------------------------+---------------+
| id                | estRows | task | access object                                         | operator info |
+-------------------+---------+------+-------------------------------------------------------+---------------+
| Update_4          | N/A     | root |                                                       | N/A           |
| └─Point_Get_6     | 1.00    | root | table:tbl_device_send_cmd_log, index:PRIMARY(uniq_id) |               |
+-------------------+---------+------+-------------------------------------------------------+---------------+
2 rows in set (0.00 sec)

MySQL [kunpeng_dms_call]> 
MySQL [kunpeng_dms_call]> UPDATE `tbl_device_send_cmd_log` SET `device_code`='ZYBSJ0086840',`sign_no`=4002,`status`=1 WHERE uniq_id = 'rpc1be6f4d4e26a4306b1bf45b5c75b65f31673537670' AND `uniq_id` = 'rpc1be6f4d4e26a4306b1bf45b5c75b65f31673537670';
Query OK, 0 rows affected (0.01 sec)
Rows matched: 1  Changed: 0  Warnings: 0

| username: tidb菜鸟一只 | Original post link

I can’t think of any scenario where you would use this SQL. You are checking uniq_id twice, and if the values are the same, it’s equivalent to checking it once. If they are different, nothing will be updated. What is the business scenario here? Writing it twice will cause the execution plan to perform a full index scan, whereas writing it once would be a point query.

EXPLAIN UPDATE `tbl_device_send_cmd_log` SET `device_code`='ZYBSJ0086840', `sign_no`=4002, `status`=1 WHERE `uniq_id` = 'rpc1be6f4d4e26a4306b1bf45b5c75b65f31673537670' AND `uniq_id` = 'rpc1be6f4d4e26a4306b1bf45b5c75b65f31673537670';

This is still a point query, but if you do:

EXPLAIN UPDATE `tbl_device_send_cmd_log` SET `device_code`='ZYBSJ0086840', `sign_no`=4002, `status`=1 WHERE `uniq_id` = 'rpc1be6f4d4e26a4306b1bf45b5c75b65f31673537670' AND `uniq_id` = 'rpc1be6f4d4e26a4306b1bf45b5c75b65f31673537671';

It will still perform a full index scan, right?

| username: 是我的海 | Original post link

Isn’t the SQL you wrote below duplicated? I didn’t quite understand it.
Looking at the execution plan I posted above, if I manually run it with two uniq_id = xxx, the execution plan is also a point query, and the speed is very fast.
But if the business runs it, what I see in the slow query is a full index scan.

Even if the business SQL is not written correctly, two uniq_id shouldn’t scan the entire index, right?

I’ll first let the business try removing the redundant uniq_id today.

| username: tidb菜鸟一只 | Original post link

No, what I mean is whether the two uniq_id you passed are consistent or not. If they are consistent, you only need to write one. If they are inconsistent, there is no need to update at all. Writing two and passing different values will definitely result in a full index scan. For example, try passing rpc1be6f4d4e26a4306b1bf45b5c75b65f31673537670 and 112312312312312312312312123123123.

| username: 是我的海 | Original post link

The values being passed are all the same, but the execution plan shows a full table scan. As follows:

                         Plan:  id                      task            estRows         operator info                                                                                                                                                                                                  actRows         execution info                                                                                                                                                                                                                                                                                                                                                                                                                                                                                                                                                                                memory         disk
        Update_4                root            0               N/A                                                                                                                                                                                                            0               time:2m53.6s, loops:1,                                                                                                                                                                                                                                                                                                                                                                                                                                                                                                                                                                        0 Bytes         N/A
        └─Selection_10          root            1.01            eq(kunpeng_dms_call.tbl_device_send_cmd_log.uniq_id, "rpc7b57f49908294744a5f1309f39aeac111673538200"), eq(kunpeng_dms_call.tbl_device_send_cmd_log.uniq_id, "rpc7b57f49908294744a5f1309f39aeac111673538200")   0               time:2m53.6s, loops:1                                                                                                                                                                                                                                                                                                                                                                                                                                                                                                                                                                         6.70 KB         N/A
          └─IndexLookUp_9       root            1.01                                                                                                                                                                                                                           0               time:2m53.6s, loops:1,                                                                                                                                                                                                                                                                                                                                                                                                                                                                                                                                                                        354 Bytes       N/A
            ├─Selection_8       cop[tikv]       1.01            eq(kunpeng_dms_call.tbl_device_send_cmd_log.uniq_id, "rpc7b57f49908294744a5f1309f39aeac111673538200"), eq(kunpeng_dms_call.tbl_device_send_cmd_log.uniq_id, "rpc7b57f49908294744a5f1309f39aeac111673538200")   0               time:2m53.6s, loops:1, cop_task: {num: 456, max: 32.3s, min: 228.5ms, avg: 5.43s, p95: 20.3s, max_proc_keys: 1305408, p95_proc_keys: 1212810, tot_proc: 41m5.1s, tot_wait: 9.79s, rpc_num: 456, rpc_time: 41m15.2s, copr_cache_hit_ratio: 0.00}, tikv_task:{proc max:973ms, min:226ms, p80:661ms, p95:744ms, iters:469212, tasks:456}, scan_detail: {total_process_keys: 478358738, total_process_keys_size: 33906243952, total_keys: 478359688, rocksdb: {delete_skipped_count: 310, key_skipped_count: 478359522, block: {cache_hit_count: 518277, read_count: 101, read_byte: 5.02 MB}}}   N/A             N/A
            │ └─IndexFullScan_6 cop[tikv]       1709241802      table:tbl_device_send_cmd_log, index:PRIMARY(uniq_id), keep order:false                                                                                                                                        478358738       tikv_task:{proc max:891ms, min:169ms, p80:568ms, p95:643ms, iters:469212, tasks:456}                                                                                                                                                                                                                                                                                                                                                                                                                                                                                                          N/A             N/A
            └─TableRowIDScan_7  cop[tikv]       1.01            table:tbl_device_send_cmd_log, keep order:false                                                                                                                                                                0                                                                                                                                                                                                                                                                                                                                                                                                                                                                                                                                                                                                             N/A             N/A
                  Plan_digest: 3cdd8c63b2c7ae87f199bc9169f173bd4fe22337c634f361182fc532a63fd9b6
                    Prev_stmt: 
                        Query: UPDATE `tbl_device_send_cmd_log` SET `device_code`=?,`sign_no`=?,`status`=? WHERE uniq_id = ? AND `uniq_id` = ? [arguments: ("ZYBSJ0129423", 4002, 1, "rpc7b57f49908294744a5f1309f39aeac111673538200", "rpc7b57f49908294744a5f1309f39aeac111673538200")];
| username: 是我的海 | Original post link

Problem solved:
The R&D team rewrote the SQL to remove the redundant uniq_id. After redeployment, the previous issue did not reoccur. The rewritten SQL is as follows:
UPDATE tbl_device_send_cmd_log SET device_code=‘xxxxxx’, sign_no=4002, status=1 WHERE uniq_id = ‘xxxxxx’;

| username: dbaspace | Original post link

In versions v4 and v5, it is also a range table scan. Only by changing it to IN can it perform a point query.

| username: dbaspace | Original post link

The problem is solved. Next time, remember to use points to send a keyboard.