Note:
This topic has been translated from a Chinese forum by GPT and might contain errors.
Original topic: 急!急!急!求助官方!恢复中控节点后监控页面无法访问和离线
[TiDB Usage Environment] Production Environment
[TiDB Version] 5.0.1
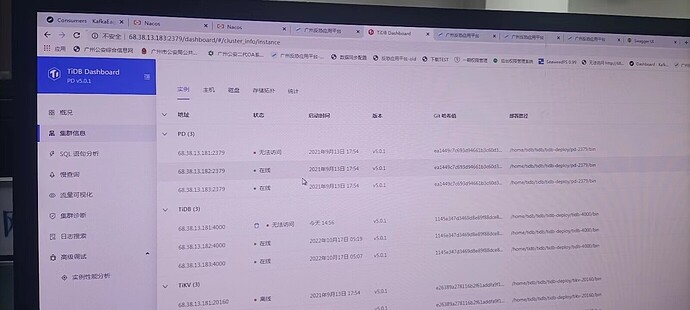
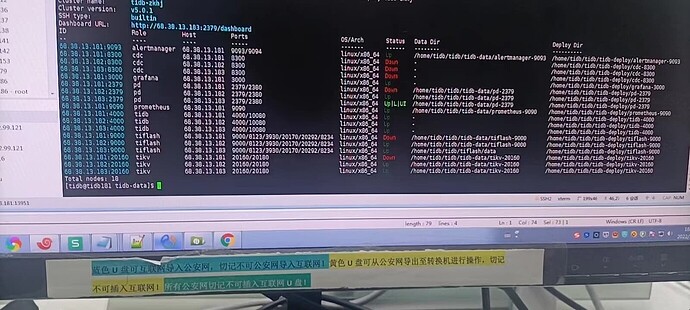
[Encountered Problem] After restoring the control node, the monitoring page cannot be accessed and is offline, but the corresponding TiDB node can be connected normally.
[Reproduction Path] Operations performed that led to the problem
[Problem Phenomenon and Impact]
Monitoring
tikv
pd
cdc
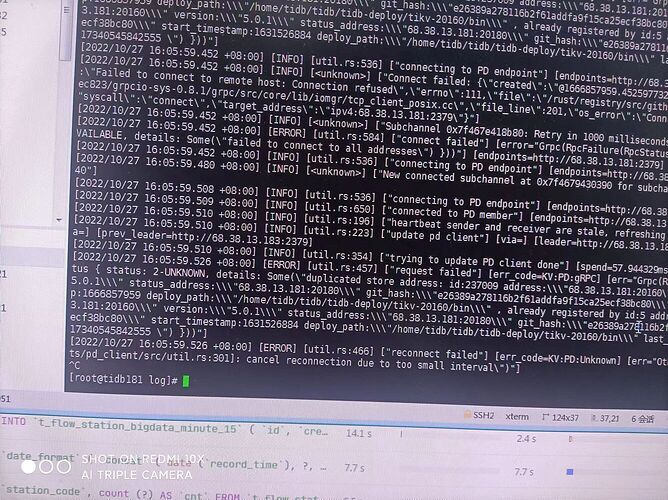
Check the PD and connectivity.
Is this node started? If it is started, check if it can connect to 2379.
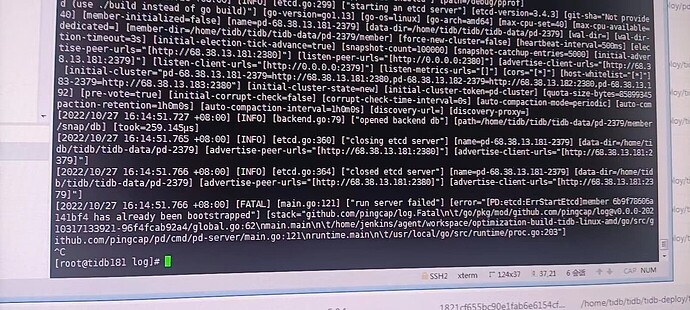
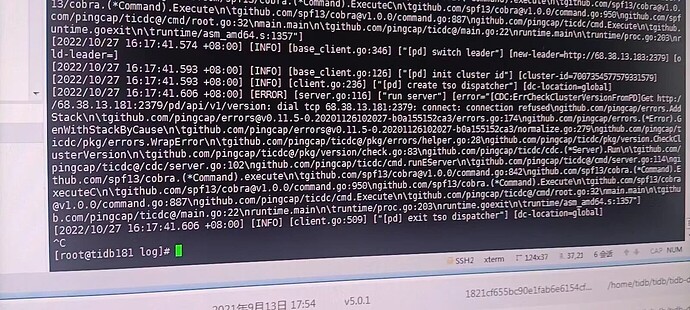
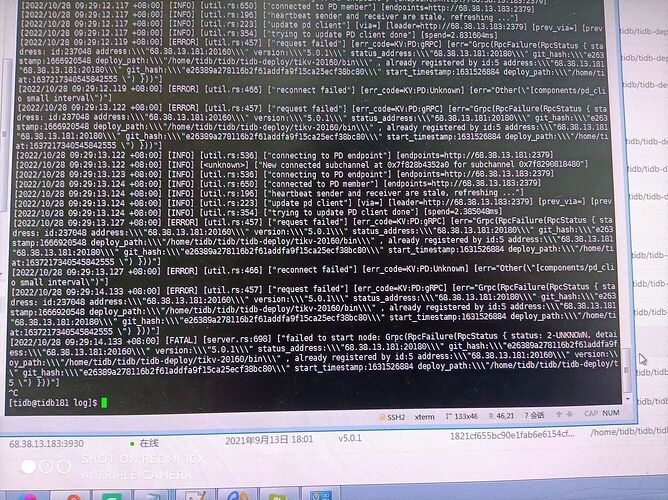
The picture shows that PD cannot start, and there is also a picture of it.
Please post the error log for the PD startup failure.
Is your issue somewhat similar to this one?
Is this a mixed deployment where one of the machines has an issue? Please describe it in detail.
It’s somewhat similar, but it seems like the PD node automatically repaired itself overnight. This morning, it’s back online, but the TiKV and TiFlash nodes are still not functioning properly.
Check the logs of each component, and pay attention to resource issues when deploying in a mixed environment.
This node has an issue. You can scale down first and then scale up.
