Note:
This topic has been translated from a Chinese forum by GPT and might contain errors.
Original topic: v6.1.2 TIFlash AVAILABLE和PROGRESS 均为0
[TiDB Usage Environment] Production Environment
[TiDB Version] 6.1.2
[Reproduction Path] alter table t set TIFLASH REPLICA 1;
[Encountered Problem: Symptoms and Impact]
TiFlash AVAILABLE and PROGRESS are both 0
mysql> show create table test_djx \G
*************************** 1. row ***************************
Table: test_djx
Create Table: CREATE TABLE
test_djx (
id int(11) DEFAULT NULL
) ENGINE=InnoDB DEFAULT CHARSET=utf8mb4 COLLATE=utf8mb4_bin /*T![placement] PLACEMENT POLICY=
storeonssd */
According to the official documentation troubleshooting results:
-
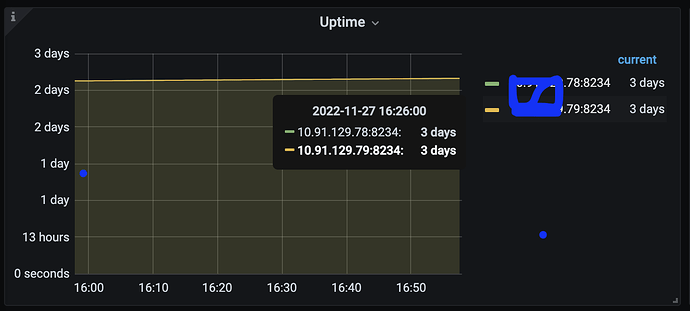
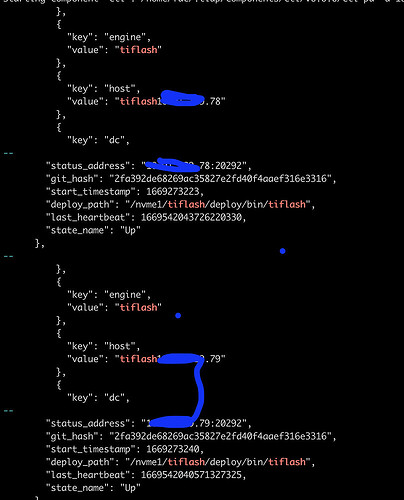
TiFlash is started normally
-
Use pd-ctl to check if PD’s Placement Rules feature is enabled:
-
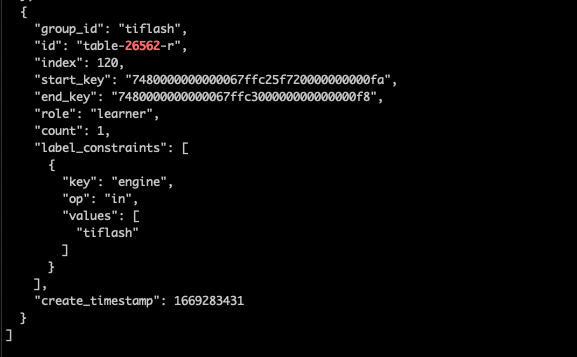
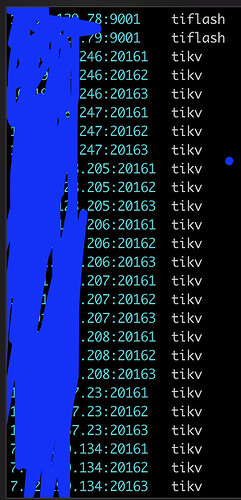
Check the status of TiFlash proxy via pd-ctl:
-
Check if the configured replica count is less than or equal to the number of TiKV nodes in the cluster. If the configured replica count exceeds the number of TiKV nodes, PD will not synchronize data to TiFlash: The replica count of 1 is definitely less than the number of nodes.
-
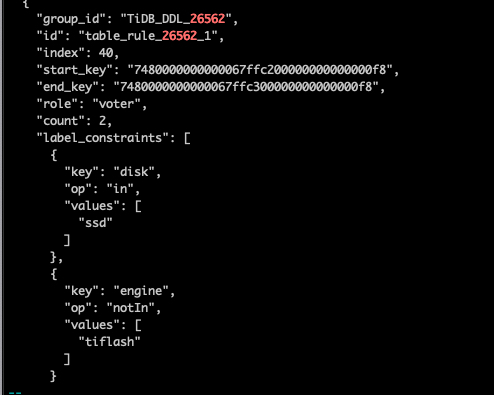
Check if PD has set placement-rule for the table


-
Check if TiDB has created placement-rule for the table
Search the TiDB DDL Owner logs to check if TiDB has notified PD to add placement-rule. For non-partitioned tables, search for ConfigureTiFlashPDForTable; for partitioned tables, search for ConfigureTiFlashPDForPartitions:
Confirm the presence of the keyword.
[Resource Configuration]
[Attachments: Screenshots/Logs/Monitoring]
Cluster Configuration:
Because it was caused by setting this.
The documentation has a section that says this, not sure if 6.1.2 is the same.
I see that version 6.1.2 supports setting both at the same time.
Check these two logs: tiflash_tikv.log and tiflash.log to see what’s in them.
The tiflash.log continuously outputs the following logs:
[2022/11/28 14:49:55.410 +08:00] [DEBUG] [PageEntriesVersionSetWithDelta.cpp:369] ["PageStorage:db_1.t_26562.meta gcApply remove 1 invalid snapshots, 1 snapshots left, longest lifetime 0.000 seconds, created from thread_id 0, tracing_id "] [thread_id=34]
[2022/11/28 14:49:55.410 +08:00] [DEBUG] [PageEntriesVersionSetWithDelta.cpp:369] ["PageStorage:db_1.t_26562.data gcApply remove 1 invalid snapshots, 1 snapshots left, longest lifetime 0.000 seconds, created from thread_id 0, tracing_id "] [thread_id=34]
[2022/11/28 14:49:55.410 +08:00] [DEBUG] [PageEntriesVersionSetWithDelta.cpp:369] ["PageStorage:db_1.t_26562.log gcApply remove 1 invalid snapshots, 1 snapshots left, longest lifetime 0.000 seconds, created from thread_id 0, tracing_id "] [thread_id=34]
[2022/11/28 14:50:00.141 +08:00] [DEBUG] [DeltaMergeStore.cpp:1758] [“DeltaMergeStore:db_1.t_26562 GC on table t_26562 start with key: 9223372036854775807, gc_safe_point: 437672540880764928, max gc limit: 100”] [thread_id=28]
[2022/11/28 14:50:00.141 +08:00] [DEBUG] [DeltaMergeStore.cpp:1879] [“DeltaMergeStore:db_1.t_26562 Finish GC on 0 segments [table=t_26562]”] [thread_id=28]
No valuable logs were found in tiflash_tikv.log.
Also check the pd.log log of the PD leader to find the scheduling situation of the related regions of this table.
[2022/11/24 17:50:31.107 +08:00] [INFO] [rule_manager.go:244] [“placement rule updated”] [rule=“{"group_id":"tiflash","id":"table-26562-r","index":120,"start_key":"7480000000000067ffc25f720000000000fa","end_key":"7480000000000067ffc300000000000000f8","role":"learner","count":1,"label_constraints":[{"key":"engine","op":"in","values":["tiflash"]}],"create_timestamp":1669283431}”]
[2022/11/24 17:50:31.121 +08:00] [INFO] [operator_controller.go:450] [“add operator”] [region-id=9561515817] [operator=“"rule-split-region {split: region 9561515817 use policy USEKEY and keys [7480000000000067FFC200000000000000F8 7480000000000067FFC25F720000000000FA 7480000000000067FFC300000000000000F8]} (kind:split, region:9561515817(21291, 673), createAt:2022-11-24 17:50:31.121009088 +0800 CST m=+616944.596227224, startAt:0001-01-01 00:00:00 +0000 UTC, currentStep:0, size:1, steps:[split region with policy USEKEY])"”] [additional-info=“{"region-end-key":"","region-start-key":"7480000000000067FFC000000000000000F8"}”]
I am looking at it based on this.
See if there is any scheduling of the add learner type.
Our colleague checked it out and didn’t see this scheduling item. Does it need to be added manually?
That’s not what I meant. It’s about checking the operator generation in the pd.log of the PD leader.
- Confirm the specific manifestation of “slow” synchronization progress. For the problematic table, does its flash_region_count remain “unchanged” for a long time, or does it just “change slowly” (e.g., it increases by a few regions every few minutes)?
- If it is “unchanged,” you need to investigate which part of the entire workflow has an issue.
Check if there are problems in the workflow where TiFlash sets a rule for PD → PD issues AddLearner scheduling to the Region leader in TiKV → TiKV synchronizes Region data to TiFlash. Collect logs from related components (pd.log, tikv.log, tiflash_tikv.log, tiflash.log) for troubleshooting.
You can check the warn/error information in the tikv and tiflash-proxy logs to confirm if there are errors such as network isolation.
I checked the tiflash.toml and found this configuration, but the tiflash_cluster_manager.log file is missing. Is this considered abnormal? According to the documentation, flash_region_count needs to be confirmed in the tiflash_cluster_manager.log.
You can try deleting this strategy from the table as mentioned earlier.
This still doesn’t work. Our cluster is a production cluster, and it is currently configured to distribute data on hot and cold disks. If we delete it, it will be scheduled to ordinary HDDs, which might cause problems. Since I can’t see the flash_region_count (there is no tiflash_cluster_manager.log log), I will continue to follow this and take another look.
Create a test table and try it.
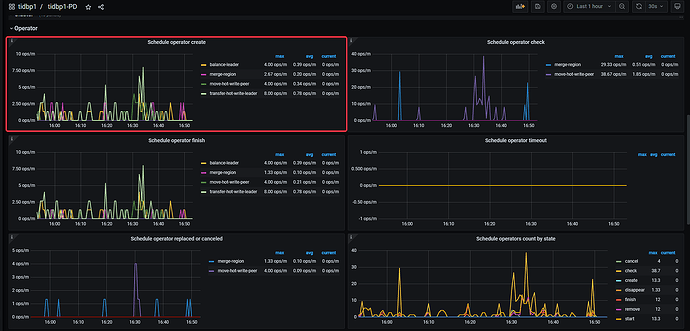
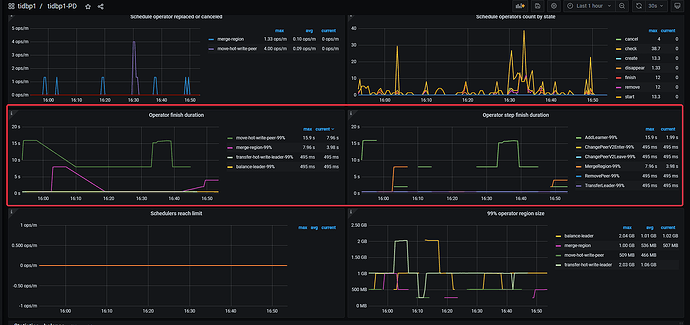
Add some monitoring charts
tiup ctl:v6.1.2 pd -u xxx:2379 operator show
test_djx Is this table always at 0 progress, or does it return to normal after a long period of time?
Is the cluster itself very large?
The current test_djx is an empty table.
