Note:
This topic has been translated from a Chinese forum by GPT and might contain errors.Original topic: v6.5.0 ticdc同步偶尔存在长时间延迟。重启ticdc之后,立即恢复正常。
[TiDB Usage Environment] Production Environment / Testing / Poc
Production Environment
[TiDB Version]
v6.5.0
[Reproduction Path] What operations were performed when the issue occurred
Not sure how to reproduce.
[Encountered Issue: Phenomenon and Impact]
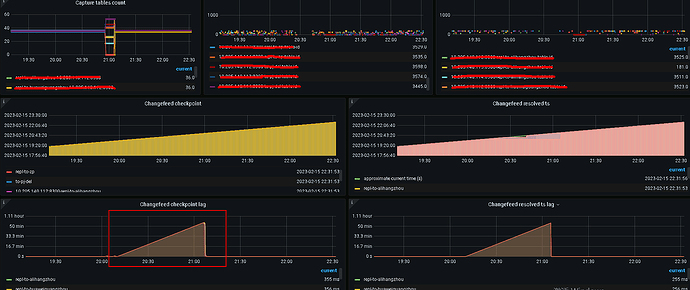
Phenomenon: Usually, there is almost no delay. The longest delay is about 1 minute. However, ticdc occasionally experiences long delays, with checkpointLag continuously increasing. After restarting ticdc, the delay immediately disappears.
[2023/02/15 20:31:30.208 +08:00] [INFO] [replication_manager.go:551] ["schedulerv3: slow table"] [namespace=default] [changefeed=repl-to-tenxunguangzhou] [tableID=2873] [tableStatus="region_count:10 current_ts:439475054874722304 stage_checkpoints:<key:\"puller-egress\" value:<checkpoint_ts:439474753250787343 resolved_ts:439474716537520134 > > stage_checkpoints:<key:\"puller-ingress\" value:<checkpoint_ts:439474753250787343 resolved_ts:439475054834876421 > > stage_checkpoints:<key:\"sink\" value:<checkpoint_ts:439474716537520134 resolved_ts:439474716537520134 > > stage_checkpoints:<key:\"sorter-egress\" value:<checkpoint_ts:439474716537520134 resolved_ts:439474716537520134 > > stage_checkpoints:<key:\"sorter-ingress\" value:<checkpoint_ts:439474753250787343 resolved_ts:439474716537520134 > > barrier_ts:439475054834876418 "] [checkpointTs=439474716537520134] [resolvedTs=439474716537520134] [checkpointLag=21m30.706968307s]
[2023/02/15 20:31:30.209 +08:00] [INFO] [replication_manager.go:551] ["schedulerv3: slow table"] [namespace=default] [changefeed=repl-to-zp] [tableID=3082] [tableStatus="region_count:1 current_ts:439475054887567360 stage_checkpoints:<key:\"puller-egress\" value:<checkpoint_ts:439474977803337743 resolved_ts:439474977803337743 > > stage_checkpoints:<key:\"puller-ingress\" value:<checkpoint_ts:439474977803337743 resolved_ts:439474977803337743 > > stage_checkpoints:<key:\"sink\" value:<checkpoint_ts:439474977737801745 resolved_ts:439474977737801745 > > stage_checkpoints:<key:\"sorter-egress\" value:<checkpoint_ts:439474977737801745 resolved_ts:439474977737801745 > > stage_checkpoints:<key:\"sorter-ingress\" value:<checkpoint_ts:439474977737801745 resolved_ts:439474977737801745 > > barrier_ts:439475054834876418 "] [checkpointTs=439474977737801745] [resolvedTs=439474977803337743] [checkpointLag=4m54.307444085s]
[2023/02/15 20:31:30.209 +08:00] [INFO] [replication_manager.go:551] ["schedulerv3: slow table"] [namespace=default] [changefeed=repl-to-zp] [tableID=3040] [tableStatus="region_count:1 current_ts:439475054888091648 stage_checkpoints:<key:\"puller-egress\" value:<checkpoint_ts:439474977803337743 resolved_ts:439474977803337743 > > stage_checkpoints:<key:\"puller-ingress\" value:<checkpoint_ts:439474977803337743 resolved_ts:439474977803337743 > > stage_checkpoints:<key:\"sink\" value:<checkpoint_ts:439474977737801745 resolved_ts:439474977737801745 > > stage_checkpoints:<key:\"sorter-egress\" value:<checkpoint_ts:439474977737801745 resolved_ts:439474977737801745 > > stage_checkpoints:<key:\"sorter-ingress\" value:<checkpoint_ts:439474977737801745 resolved_ts:439474977737801745 > > barrier_ts:439475054834876418 "] [checkpointTs=439474977737801745] [resolvedTs=439474977803337743] [checkpointLag=4m54.307444085s]
[2023/02/15 20:31:30.209 +08:00] [INFO] [replication_manager.go:551] ["schedulerv3: slow table"] [namespace=default] [changefeed=repl-to-zp] [tableID=2887] [tableStatus="region_count:5 current_ts:439475054887567360 stage_checkpoints:<key:\"puller-egress\" value:<checkpoint_ts:439474753250787343 resolved_ts:439474732082659333 > > stage_checkpoints:<key:\"puller-ingress\" value:<checkpoint_ts:439474753250787343 resolved_ts:439475054873673746 > > stage_checkpoints:<key:\"sink\" value:<checkpoint_ts:439474732082659333 resolved_ts:439474732082659333 > > stage_checkpoints:<key:\"sorter-egress\" value:<checkpoint_ts:439474732082659333 resolved_ts:439474732082659333 > > stage_checkpoints:<key:\"sorter-ingress\" value:<checkpoint_ts:439474753250787343 resolved_ts:439474732082659333 > > barrier_ts:439475054834876418 "] [checkpointTs=439474732082659333] [resolvedTs=439474732082659333] [checkpointLag=20m31.407444085s]
[Resource Configuration]
cdc.zip (612.6 KB)
[Attachments: Screenshots/Logs/Monitoring]
The attached log is the cdc owner log from 2023/02/15 20:00 to 21:20.
