Note:
This topic has been translated from a Chinese forum by GPT and might contain errors.
Original topic: 运维监控PD模块中 Region Heartbeat 左栏和右栏指标是何含义?
[TiDB Usage Environment] Production Environment
[TiDB Version] v6.3.0
[Encountered Problem: Phenomenon and Impact]
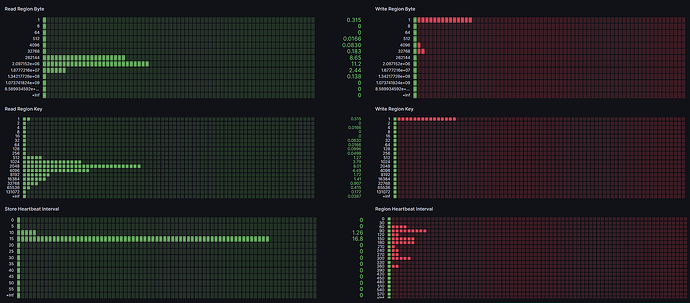
Analyzing the region bar chart, it logically indicates a hot read/write issue. Therefore, I manually split it using the following SQL:
SPLIT TABLE business_bucket_directory_node INDEX uk_uuid BETWEEN (“0”) AND (“z”) REGIONS 6;
However, after splitting, the monitoring still shows a prominent issue. Does anyone know the meaning of the indicators on the left and right columns? I checked the documentation but couldn’t find a clear explanation.
[Resource Configuration] k8s: 64g/16c/4 nodes
[Attachment: Screenshot/Log/Monitoring]
Which metrics are you referring to? The image is not clear. It would be best to list the text.
As shown above, I marked it with a red box.
My guess: On the left is the region partition end, and on the right is the average read byte ratio. However, even after manually splitting, this kind of red bar spike still exists, which should still be hot writes.
Absolutely correct guess.
However, after scattering here, the issue of hot writes still exists.
For observing hotspot issues, the official documentation always recommends using the traffic visualization chart in the Dashboard.
My traffic visualization chart doesn’t have large bright spots, but this monitoring chart shows a similar situation.
If I have to pinpoint an issue,
this uk_uuid should be an index of a character-type UUID column. UUIDs shouldn’t go up to ‘z’; the highest letter should be ‘f’. The upper and lower bounds here seem a bit inappropriate.
Theoretically, it should be from 00000000-0000-0000-0000-000000000000 to ffffffff-ffff-ffff-ffff-ffffffffffff.
The best practice also suggests not storing string-type UUIDs but using BINARY(16). Without setting the swap_flag, it’s not easy to form hotspots.
We have noticed the content in the official documentation;
We use TiDB to store file directory data, and recursive queries always start from the root directory. In the traffic visualization graph, there is always a bright block in the UUID range of the directory table.
We have some questions about this graph when observing hotspot monitoring 
In that case, replica read should be more suitable for this situation.
tidb_load_based_replica_read_threshold
Try lowering this value from 1s. It might be more suitable for your situation.
Is it a data table hotspot or an index hotspot? This needs to be addressed specifically, otherwise no matter how much you tweak it, it won’t work…
