What does flow control mean in TiKV detail Grafana?

Note:
This topic has been translated from a Chinese forum by GPT and might contain errors.

Original topic: tikv detail grafana中flow control是什么意思?

| username: lindoubled

Version:

v5.3.0

What does the above image mean? It’s not documented.

Question:
When Throttle duration appears, TiDB experiences many slow queries. How can this be optimized?

| username: ddhe9527 | Original post link

This should refer to TiKV’s server is busy flow control. You can further confirm it in the TiKV-Details → Errors → Server is busy monitoring. For more details, you can refer to the following document:

By checking the monitoring: GrafanaTiKVerrors to confirm the specific busy reason. server is busy is TiKV’s own flow control mechanism. TiKV uses this method to inform tidb/ti-client that the current TiKV is under too much pressure and to try again later.

| username: lindoubled | Original post link

Not busy at all

| username: ddhe9527 | Original post link

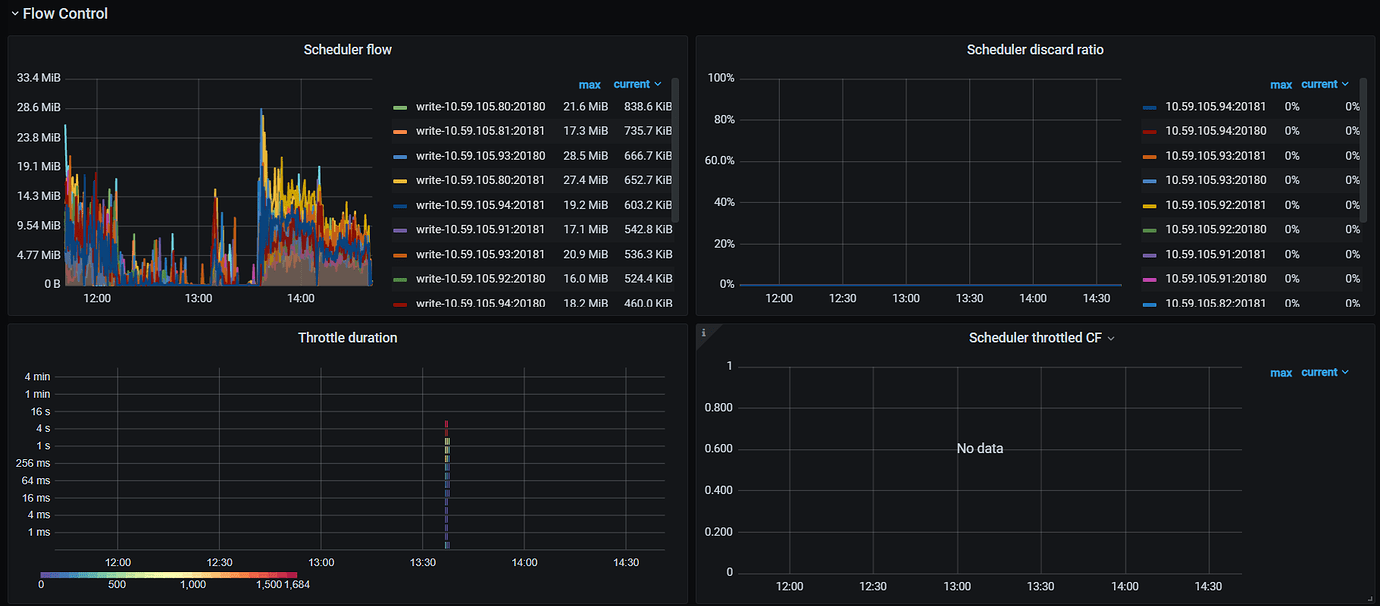
That means the flow control was not triggered, but this page is mainly used to monitor flow control, including write stall, compaction pile-up, L0 SST pile-up, etc. You can specifically check which command’s delay has increased on the Throttle duration.

| username: h5n1 | Original post link

The commit log includes network and disk writing, check these two aspects.

| username: lindoubled | Original post link

It doesn’t feel right; there’s also a commit log duration here.

Why are these metrics so messy?

| username: h5n1 | Original post link

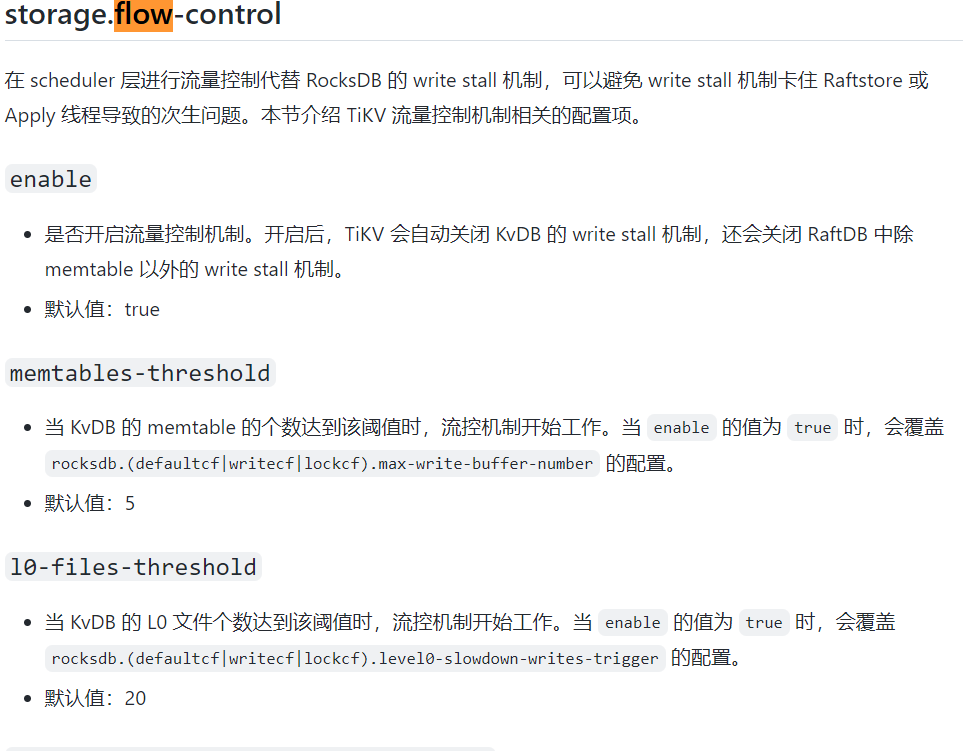
Flow control is the monitoring of scheduler flow control after version 5.2. Check if storage.flow-control is enabled. There is indeed relatively little specific description in the official documentation.

| username: lindoubled | Original post link

That should be related to these configurations:

| username: lindoubled | Original post link

The default flow-control is enabled.

| username: h5n1 | Original post link

Check the network status under black exporter/node exporter monitoring.

| username: lindoubled | Original post link

Each instance is almost like this, with a 10 Gigabit network card.

| username: h5n1 | Original post link

Blackexporter has network latency, but it is also at a 30-second granularity.

| username: lindoubled | Original post link

Something like this.

| username: h5n1 | Original post link

The network doesn’t seem very stable.

| username: system | Original post link

This topic was automatically closed 1 minute after the last reply. No new replies are allowed.