Note:
This topic has been translated from a Chinese forum by GPT and might contain errors.
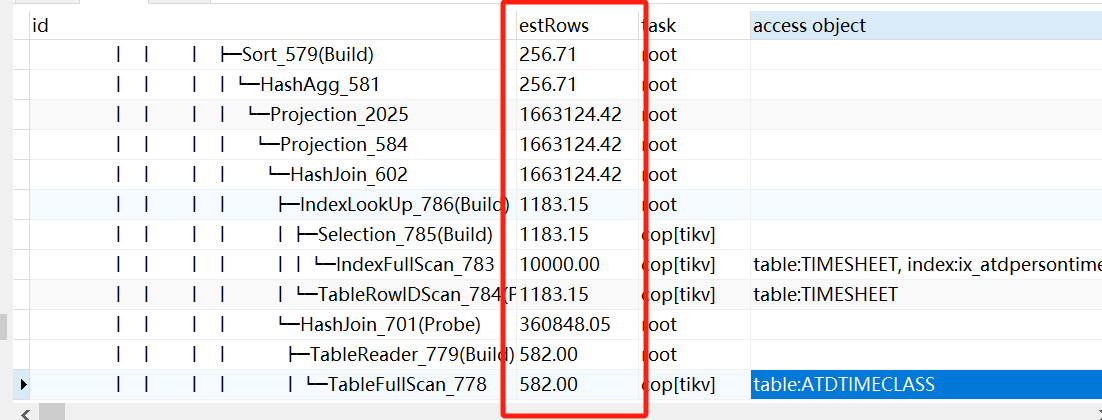
Original topic: explain中的estRows是什么作用,为什么还带有小数点,而且这个语句查询不出来,能通过explain看出来哪里慢吗?
[TiDB Usage Environment] Production Environment
[TiDB Version]
[Reproduction Path] What operations were performed when the issue occurred
[Encountered Issue: Issue Phenomenon and Impact]
[Resource Configuration] Go to TiDB Dashboard - Cluster Info - Hosts and take a screenshot of this page
[Attachments: Screenshots/Logs/Monitoring]
Result.xlsx (12.5 KB)
Why is there a decimal point?
This should be related to statistics. It is caused by collecting data based on percentages during statistics collection.
You can use EXPLAIN ANALYZE SQL to see the time consumed at each step.
Can’t see it because it directly crashed the database.
What does the percentage refer to? I don’t quite understand, what is the relationship between the estimated number of rows and the percentage?
The more rows there are, the slower the speed.
You go to a pond to catch fish, and you catch 10 fish from 11% of the area. The question is, approximately how many fish are there in the pond?
Can I now see where this SQL is slow through explain?
10 divided by 0.11 is approximately equal to 91?
This step is probably time-consuming.
The issue is that this is root, isn’t it everything? I understand it as
What I mean is that this hash join is quite time-consuming.
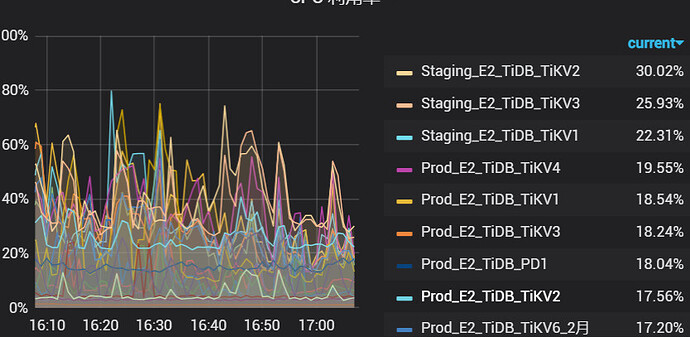
Is the configuration of TiDB not high? I feel that this query should be able to run, maybe a bit slow…
Looking at the execution plan, the data volume is not large. It might be due to inaccurate configuration information (manually collect configuration information using ANALYZE TABLE tablename). Is the system load high? Please post the cluster configuration for review.
As long as it’s a join query, there will be a hash join…

