When running TPCC with TiFlash, CPU utilization is low, and queries become particularly slow with 5 OLAP concurrent sessions

Note:
This topic has been translated from a Chinese forum by GPT and might contain errors.

Original topic: TiFlash做tpcc时,CPU利用率低,5个OLAP并发就查询特别慢

| username: TiDBer_o0MXVuK4

【TiDB Usage Environment】POC
【TiDB Version】6.1.1
【Encountered Problem】When using TiFlash for TPCC, CPU utilization is low, and queries become particularly slow with just 5 OLAP concurrent queries.
【Optimizations Done】
set @@tidb_distsql_scan_concurrency = 80;
set @@tidb_allow_batch_cop = 1;
set @@tidb_opt_agg_push_down = 1;
set @@tidb_opt_distinct_agg_push_down = 1;
SET GLOBAL tidb_max_tiflash_threads = 18;
set @@session.tidb_allow_mpp=1;
set @@session.tidb_enforce_mpp=1;
【Problem Phenomenon and Impact】
When not running TPCC, a single count query is very fast, but once TPCC is running, it becomes extremely slow (TPCC test is also very slow, and executing a single count query is also slow). CPU shows no pressure, and memory and disk utilization are also very low. I am purely executing OLAP, with OLTP threads at 0, so there is no interference from writes. It feels like some thread count setting is incorrect, and enabling MPP has no effect.

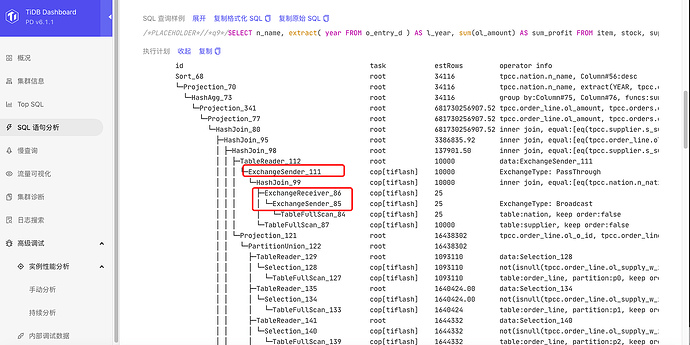
【Attachment】Execution Plan
| username: TiDBer_o0MXVuK4 | Original post link

[Supplement]

  1. Performing a count operation on a single table with tens of millions of rows takes over 100ms (2 seconds with TiKV, 100ms with TiFlash).
  2. If tpcc is given 5 OLAP threads, each tpcc query takes tens of seconds, and the aforementioned individual count operation increases from 100ms to tens of seconds.
    Stopping tpcc, the individual query immediately returns to 100ms.
| username: flow-PingCAP | Original post link

You can try measuring the time taken for concurrent execution of count. Additionally, you can use this tool https://metricstool.pingcap.com/ to export the tiflash-summary monitoring data, including the time range for the above loads.

| username: xiaour | Original post link

You can analyze in the monitoring tool whether it is due to high disk or system load.

| username: TiDBer_o0MXVuK4 | Original post link

Disk and system load are particularly low, no noticeable impact.

| username: yilong | Original post link

Please refer to the above reply and export the tiflash-summary monitoring. Thanks.