Note:
This topic has been translated from a Chinese forum by GPT and might contain errors.
Original topic: tidb集群遇到大量的查询请求,io读非常高,重启整个集群tikv的IO读无法下降
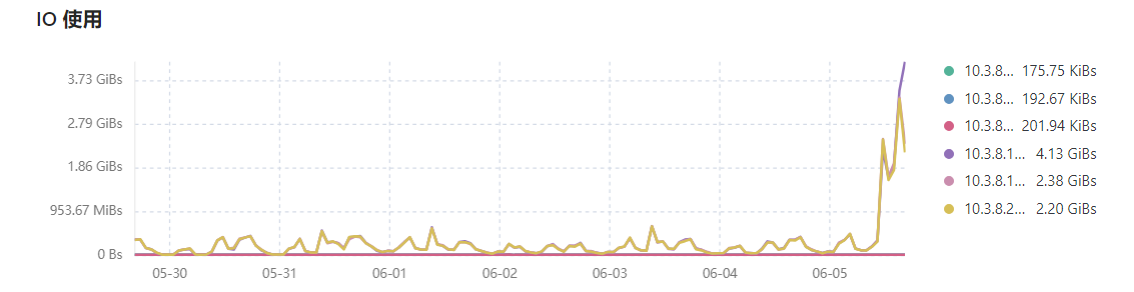
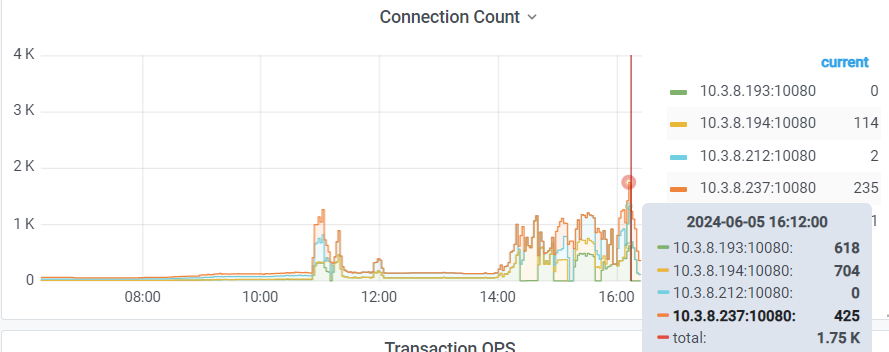
The TiDB cluster is encountering a large number of query requests, causing the IO read on the 3 KV nodes to be very high. Restarting the entire cluster does not reduce the TiKV IO read.
First, look at the slow SQL.
I think the problem might be related to the configuration of the TiDB cluster. You can check the configuration files of PD, TiKV, and TiDB to see if there are any issues. Additionally, you can also check the logs of each component to find more detailed error information.
I just shut down the gateway and the entire TiDB cluster for a few minutes, then restarted the cluster. After opening the gateway, TiDB requests increased, and TiKV’s IO read also started to rise continuously.
Okay, I’ll check the slow SQL.
Querying causes a large amount of disk I/O. First, check slow queries and optimize indexes. Second, look at Grafana (TiKV) to see where the slowness is. Check if there are any configuration issues. Think about whether there are any other operations.
Looking at the dashboard for slow SQL and optimizing slow SQL is the solution; restarting cannot solve the problem.
Check slow SQL in the dashboard, investigate SQL with a large number of requests one by one.
The issue from yesterday has been resolved. The reason was that a business table with 6 million rows had low health, and a large number of queries on the business side were using this table for join queries. After performing ANALYZE TABLE table_name to collect statistics on this table, the IO read on TiKV immediately dropped.
The parameters that need to be adjusted are as follows:
-- 1. Enable the automatic statistics collection feature:
mysql> show variables like 'tidb_enable_auto_analyze';
+--------------------------+-------+
| Variable_name            | Value |
+--------------------------+-------+
| tidb_enable_auto_analyze | ON    |
+--------------------------+-------+
1 row in set (0.00 sec)

-- 2. Adjust the tidb_auto_analyze_ratio parameter from the original 0.7 to 0.3, which means that when more than 30% of the rows in the table are modified, automatic ANALYZE will be triggered to update.

mysql> show variables like 'tidb_auto_analyze_ratio';
+-------------------------+-------+
| Variable_name           | Value |
+-------------------------+-------+
| tidb_auto_analyze_ratio | 0.3   |
+-------------------------+-------+
1 row in set (0.00 sec)

-- 3. Change the start time to Beijing time, representing the period from 00:00 to 08:00 for automatic collection.

mysql> set global tidb_auto_analyze_start_time='00:00 +0800';
Query OK, 0 rows affected (0.01 sec)

mysql> set global tidb_auto_analyze_end_time ='08:00 +0800';
Query OK, 0 rows affected (0.03 sec)
I remember there is a parameter that can automatically kill the timed-out SQL.
First, check the slow SQL on the dashboard, as well as the indexes, and the statistics information of the slow SQL table, etc.
The low health score leads to incorrect indexing, which is quite common. Analyze is one solution. Another is to bind the execution plan, so the table’s health score won’t affect it anymore.