Note:
This topic has been translated from a Chinese forum by GPT and might contain errors.
Original topic: TIDB 空闲&活跃链接数相关的监控项哪里能获取
[TiDB Usage Environment] Production Environment
[TiDB Version] v6.1.7
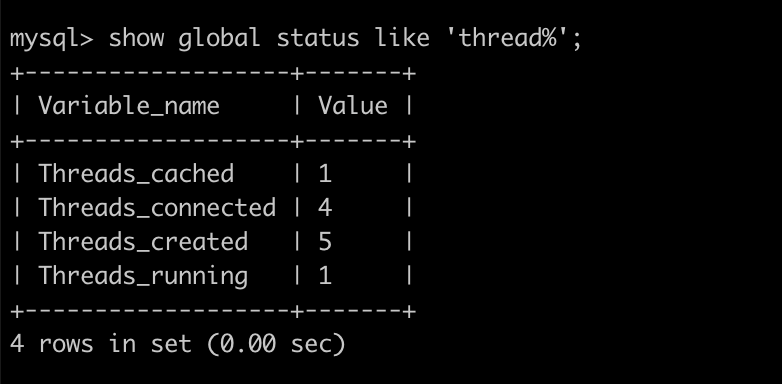
[Encountered Problem: Problem Phenomenon and Impact] How to obtain monitoring items for thread_connected idle connections and thread_running active connections in TiDB, as shown in the following image:
I guess you want to see SELECT * FROM METRICS_SCHEMA.tikv_threads_state;
This is a record of the state of TiKV threads.
I want to see data related to threads in the TIDBServer layer.
sum(rate(tidb_server_handle_query_duration_seconds_sum{k8s_cluster=“$k8s_cluster”,tidb_cluster=“$tidb_cluster”, sql_type!=“internal”}[1m])) I see that the formula for calculating active connections in the monitoring is like this, but I don’t understand why it’s calculated this way 
tidb-server generally looks at connection-related metrics, not thread-related ones, right?
SELECT * FROM METRICS_SCHEMA.tidb_connection_count;
Take a look at INFORMATION_SCHEMA.PROCESSLIST
It’s a good method, you can retrieve it using SQL.
The implementation of threads_connected for tidb-server can refer to the answer above, and the implementation of threads_running can refer to this article:
It seems that by using
select count(*) count from information_schema.processlist where Command !='Sleep';
you can get the monitoring of thread_running. 
Just write a script yourself to check it periodically.
threads_connected:
SELECT instance, SUBSTRING_INDEX(group_concat(value ORDER BY time DESC), ‘,’, 1) AS value FROM METRICS_SCHEMA.tidb_connection_count GROUP BY instance;
This topic was automatically closed 60 days after the last reply. New replies are no longer allowed.