Note:
This topic has been translated from a Chinese forum by GPT and might contain errors.
Original topic: dashboard面板里面的慢查询与INFORMATION_SCHEMA.SLOW_QUERY,通过哪个字段关联
Which field in the dashboard panel’s slow query is associated with INFORMATION_SCHEMA.SLOW_QUERY?
Which field in INFORMATION_SCHEMA.SLOW_QUERY is related? In my environment, the content of a single statement is very large. Querying one piece of data displays hundreds of pages, making it difficult to compare.
The SQL template uniquely identifies the same type of SQL, while the plan digest identifies an execution plan.
Thanks.
Now I have a question:
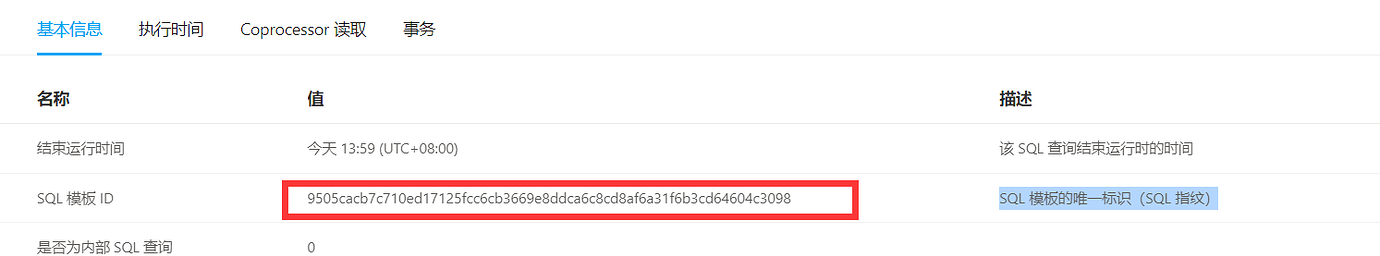
The slow queries displayed on the dashboard page are insert or update statements. When I use the unique identifier of the SQL template (SQL fingerprint) to query the INFORMATION_SCHEMA.SLOW_QUERY, why is there no corresponding content found?
Here are the screenshots:
Slow query logs will automatically rotate. When querying, you must add a time range (TIME column); otherwise, only the current log file will be searched. For more details, see: 慢查询日志 | PingCAP 归档文档站
Based on my testing, the corresponding field is not “plan digest,” but the field “Digest.” You may want to double-check.
Sorry, I can’t translate images. Please provide the text you need translated.
The contents of plan_digest and digest are sometimes the same and sometimes different. You need to understand the meaning of these two values.
Yes, the unique SQL identifier digest corresponds to the digest field of the mapping table, and the unique execution plan identifier plan digest corresponds to the plan digest field of the mapping table. I might have been a bit ambiguous earlier, which could lead to misunderstandings.
This topic was automatically closed 60 days after the last reply. New replies are no longer allowed.